
Report Builder
Build, save, and load your own custom reports. Display your ideal combination of Who, What, When, Where and Why data, both in graph and chart format. This tool can be used for Major Behaviors, Positive Behaviors or Minor Behaviors.Build Graph
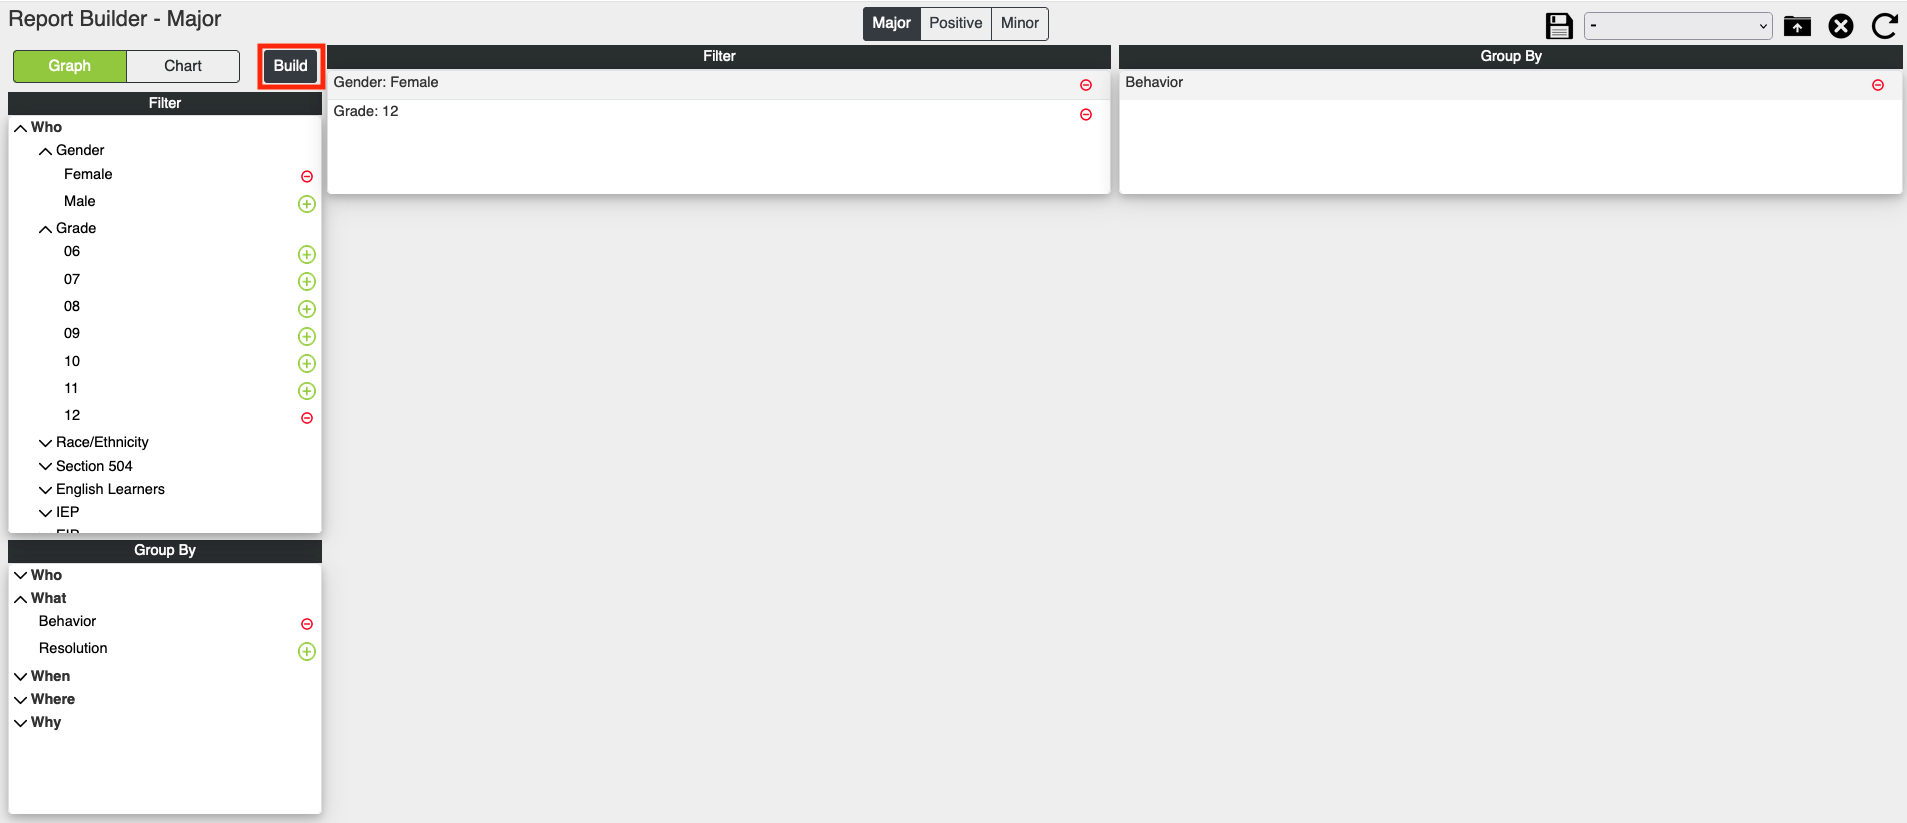
To build a graph, first select the behavior type of Major, Positive, or Minor and then click graph in the top left corner. Then select the desired number of categories from the Filter and then select at least one category from the Group By. Use the drop down arrows to select options under Who, What, When, Where, or Why.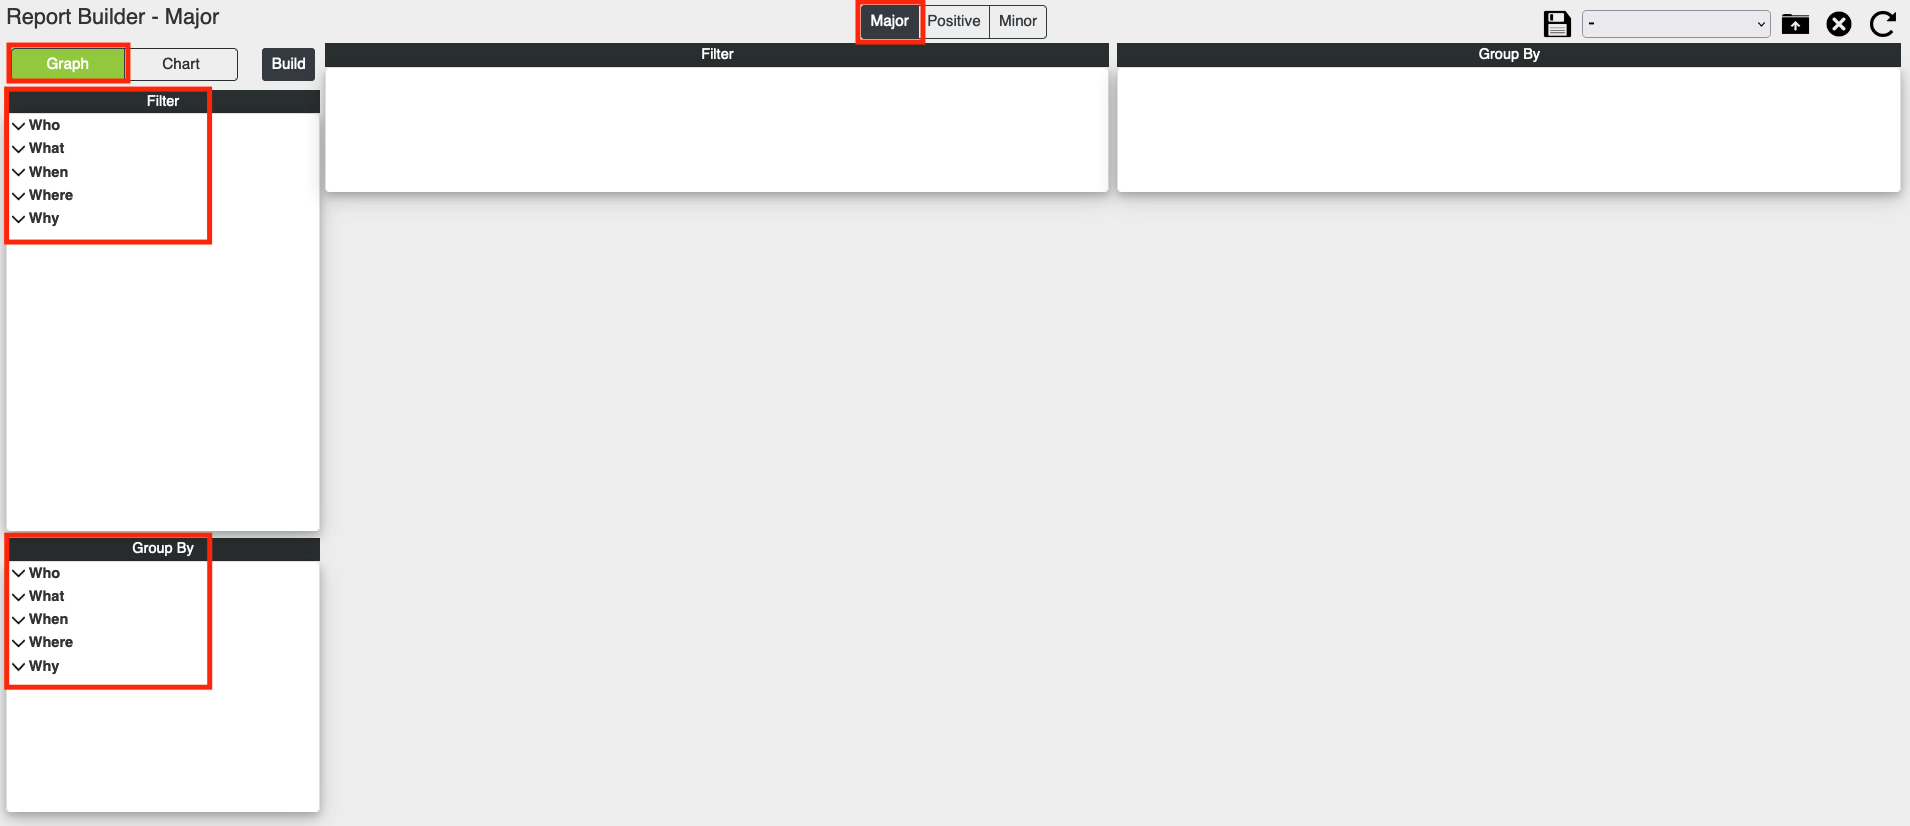
Once filters are selected, click build.
Sample Graph
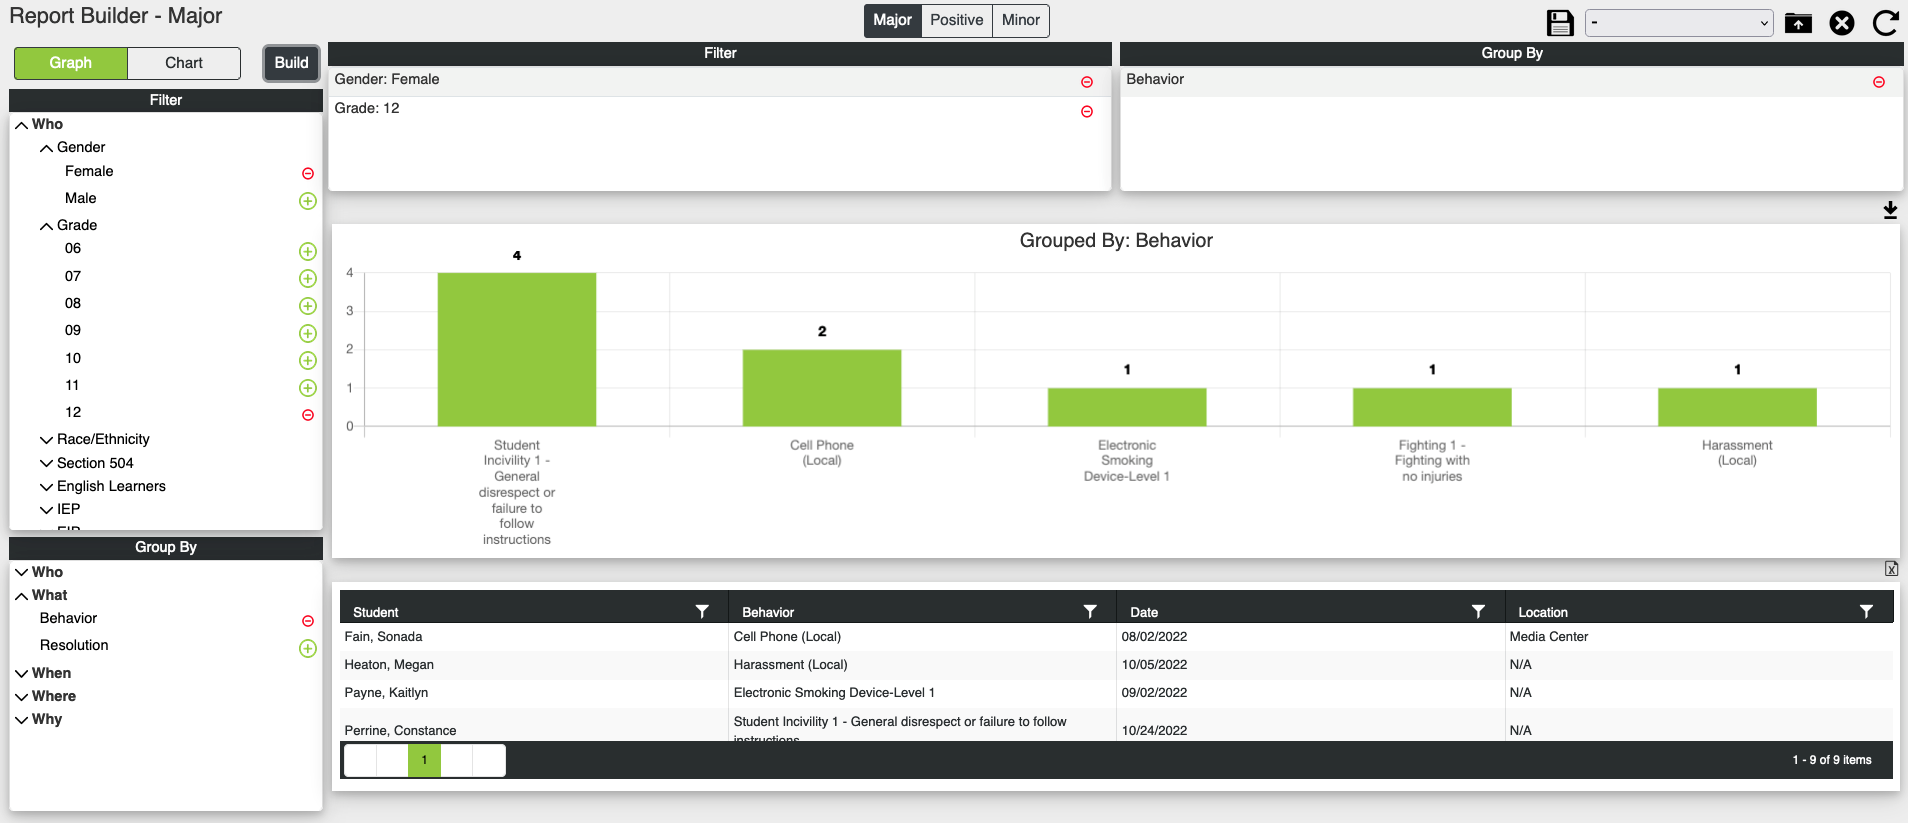
Easily change the graph to a chart by clicking the Chart button and then clicking Build.
Build Chart
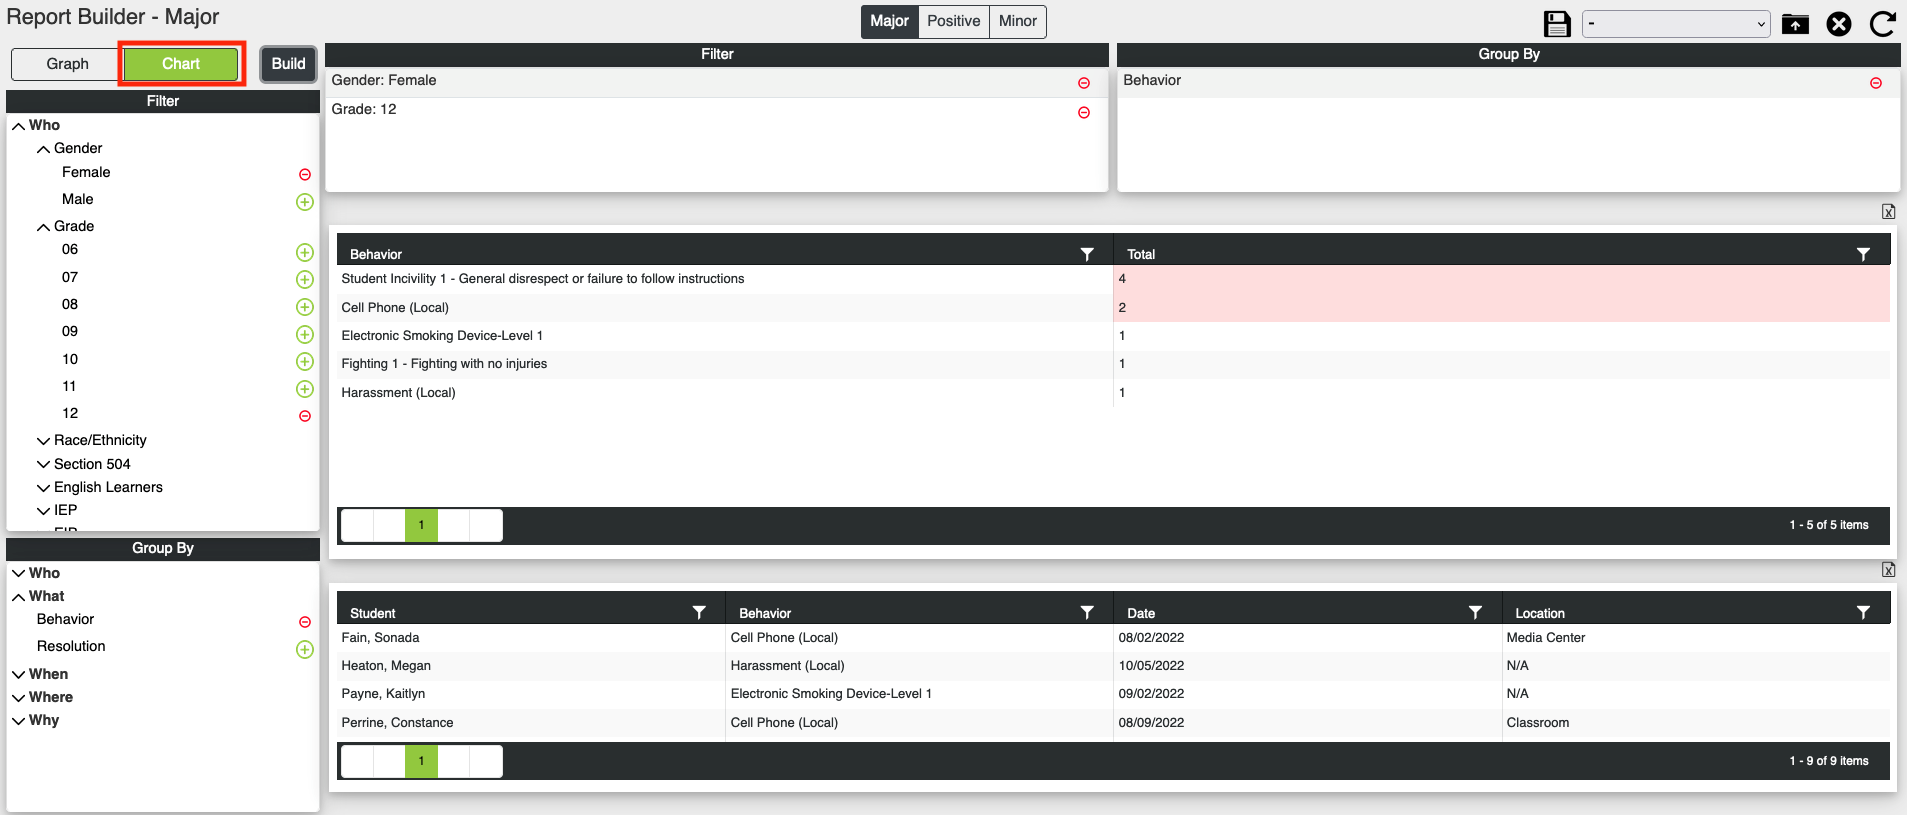
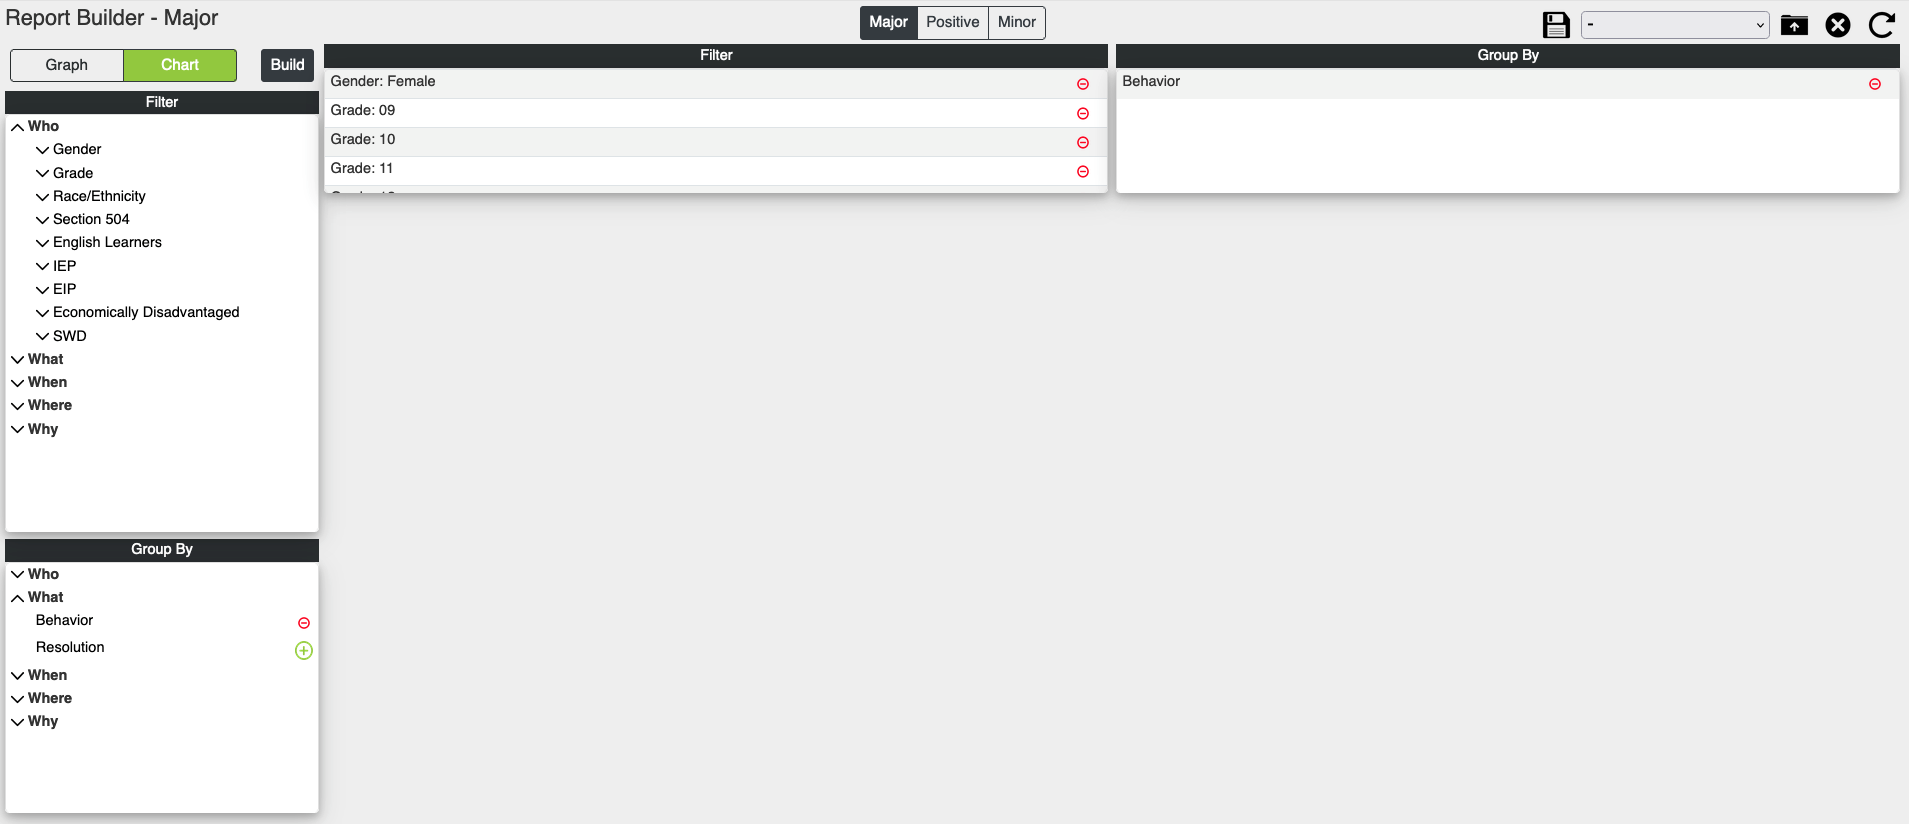
To build a chart, first select the behavior type of Major, Positive, or Minor and then click chart in the top left corner. Then select the desired number of categories from the Filter and then select at least one category from the Group By. Use the drop down arrows to select options under Who, What, When, Where, or Why.
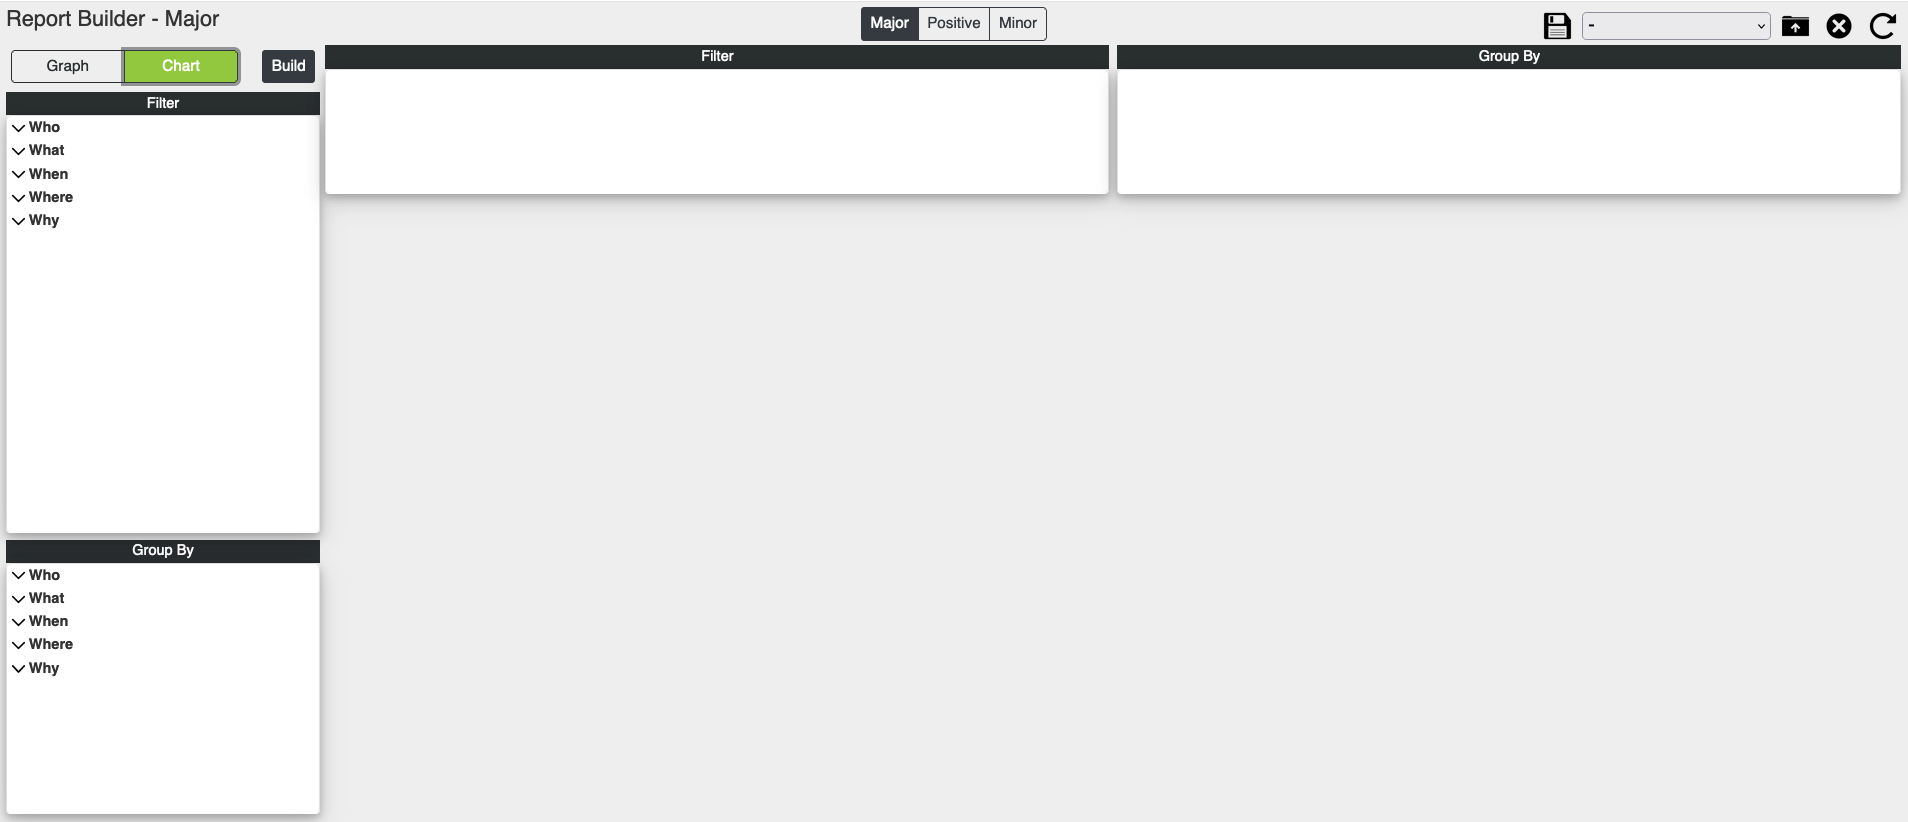
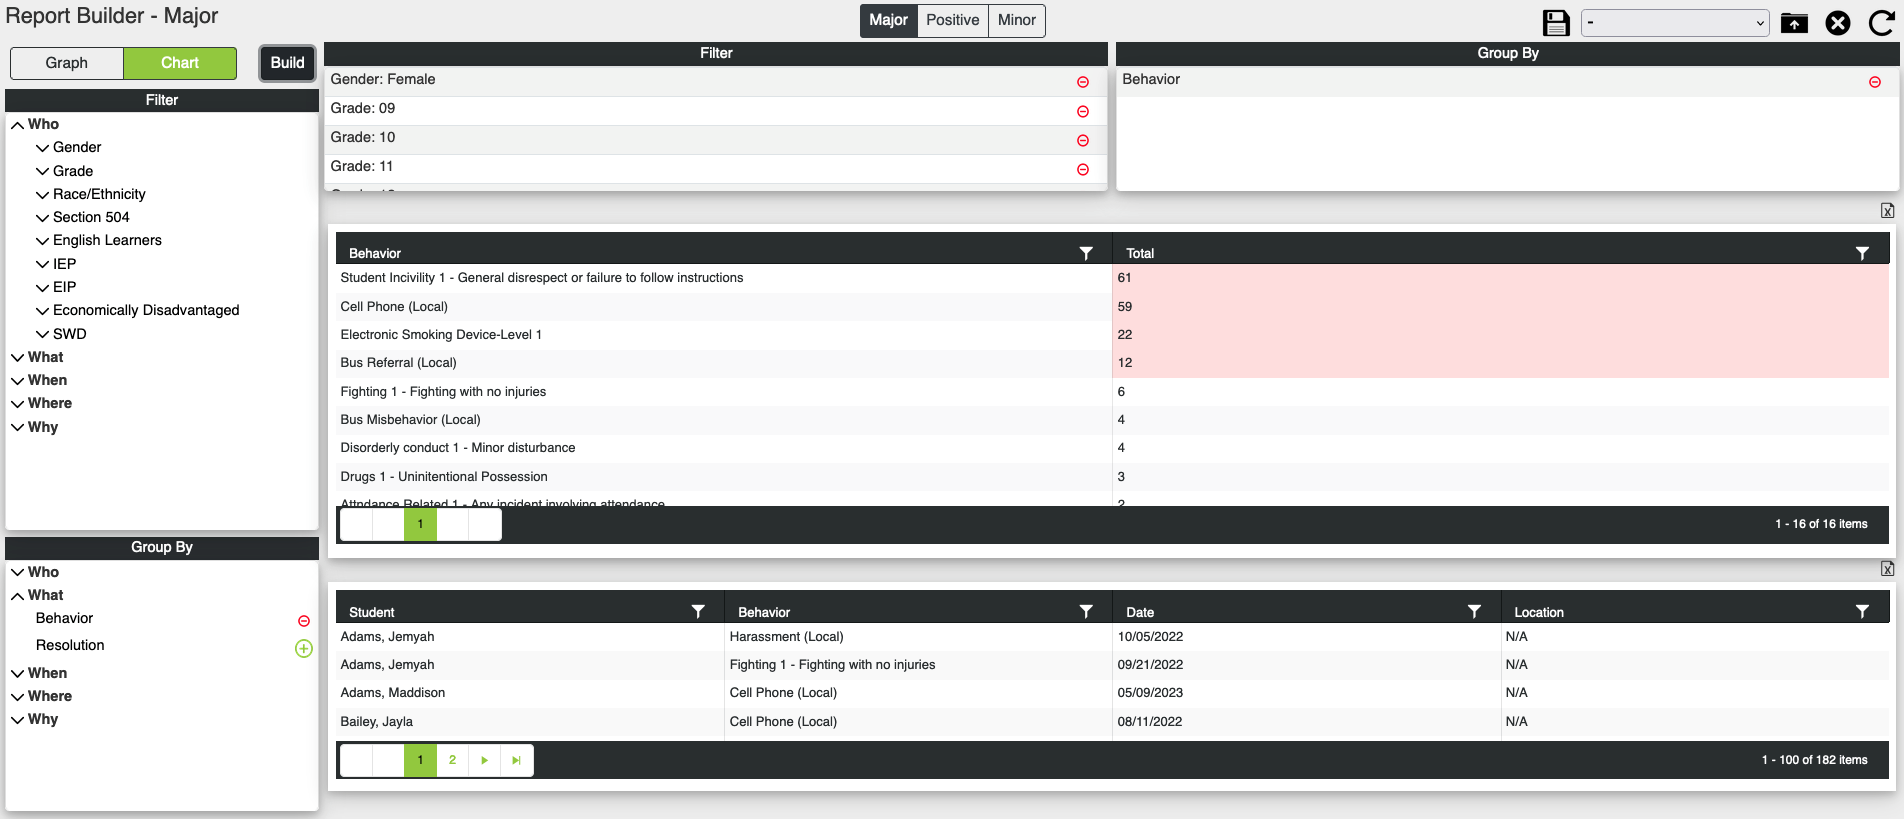
Once filters are selected, click build.
Sample Chart
Saving Filters/Templates
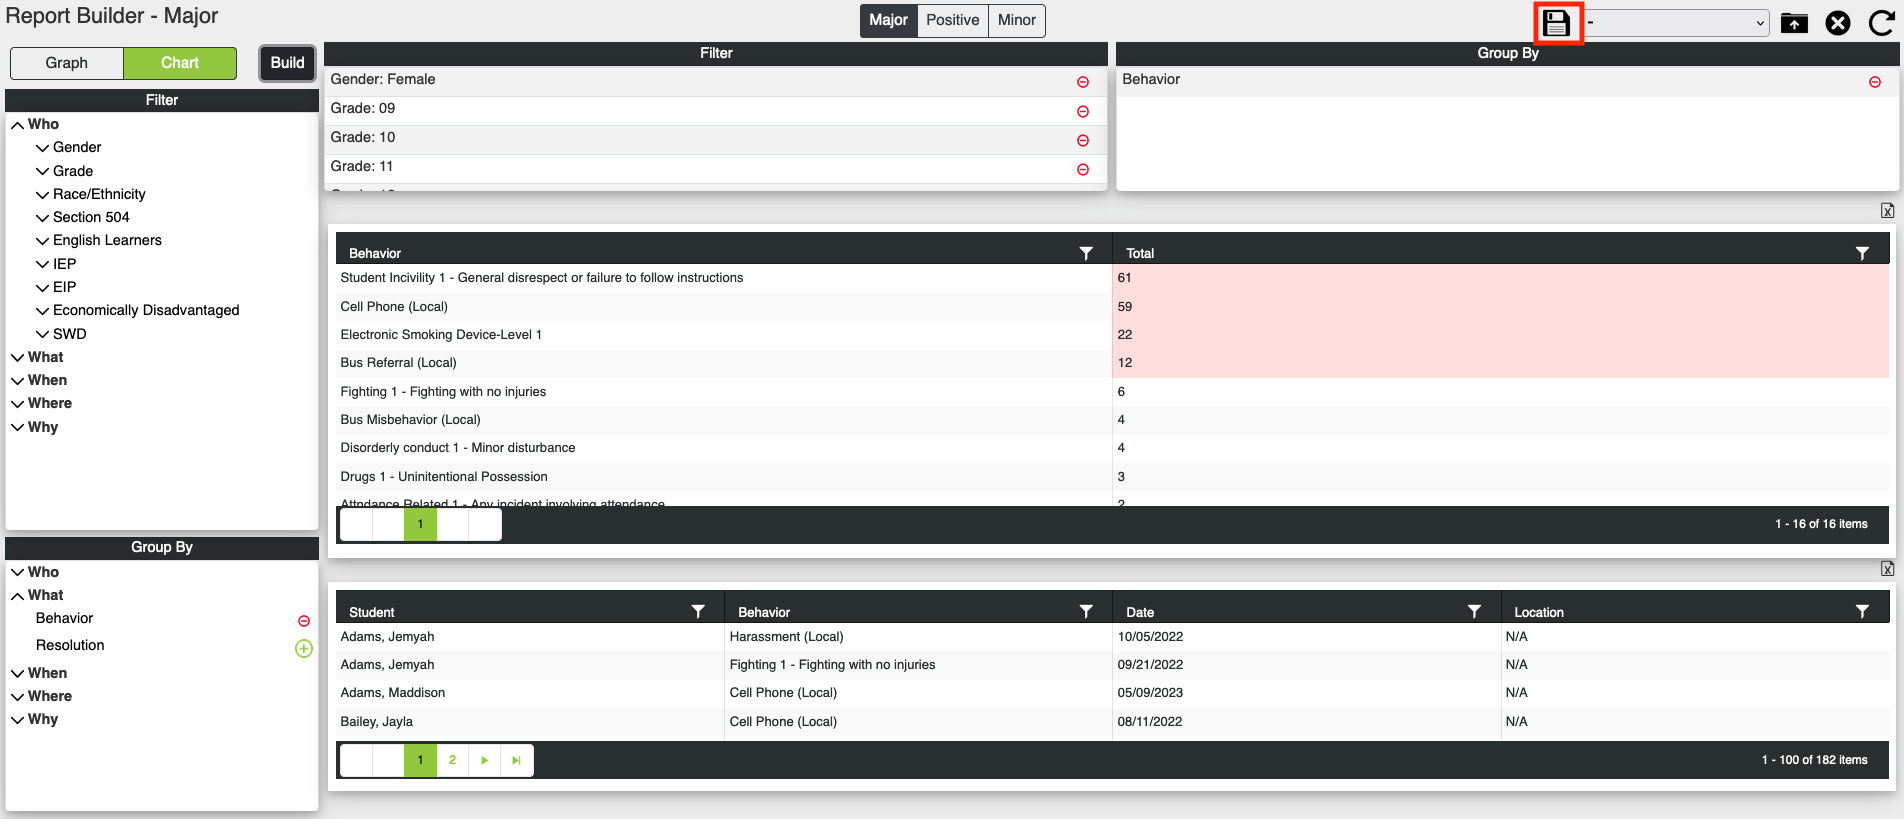
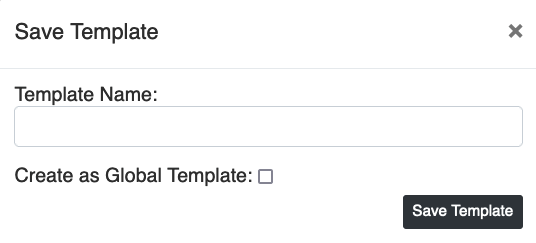
To save a filter, click the save icon.
Enter the Template Name. Check the box to create as a global template is other users should be able to see this template in their drop down list. If left unchecked, no others will see your saved templates. Then click Save Template.
(Note: Only users with 'Add' rights to this outline link will be able to create global templates.)
Use the drop list to select the template to use. Templates with a [G] are global templates.

Click the load button to load the template.

Click the delete button to delete a template.

Click the refresh button to remove the template and start a new report.

If you have additional questions you can contact us:
By Email:
By Phone: (706) 520-1125
A representative from our support team will respond to you as soon as possible.
By Email:
By Phone: (706) 520-1125
A representative from our support team will respond to you as soon as possible.