Admin Dashboard
The admin dashboard is a way for school level staff to compare major and classroom behavior. The home screen of the admin dashboard begins by viewing Major Behaviors. Use the navigation bar to view Classroom Behaviors, Student Overview, Teacher Overview, Reports, and SpotLight Store.Major Behaviors
Use the Who/What/When/Where/Why/All tabs to view behavior data based on grade, resolution, time, and motivation. Use the All tab to view a complete list of behaviors at your school. Use the dropdown filter to fine tune exactly what information is displayed.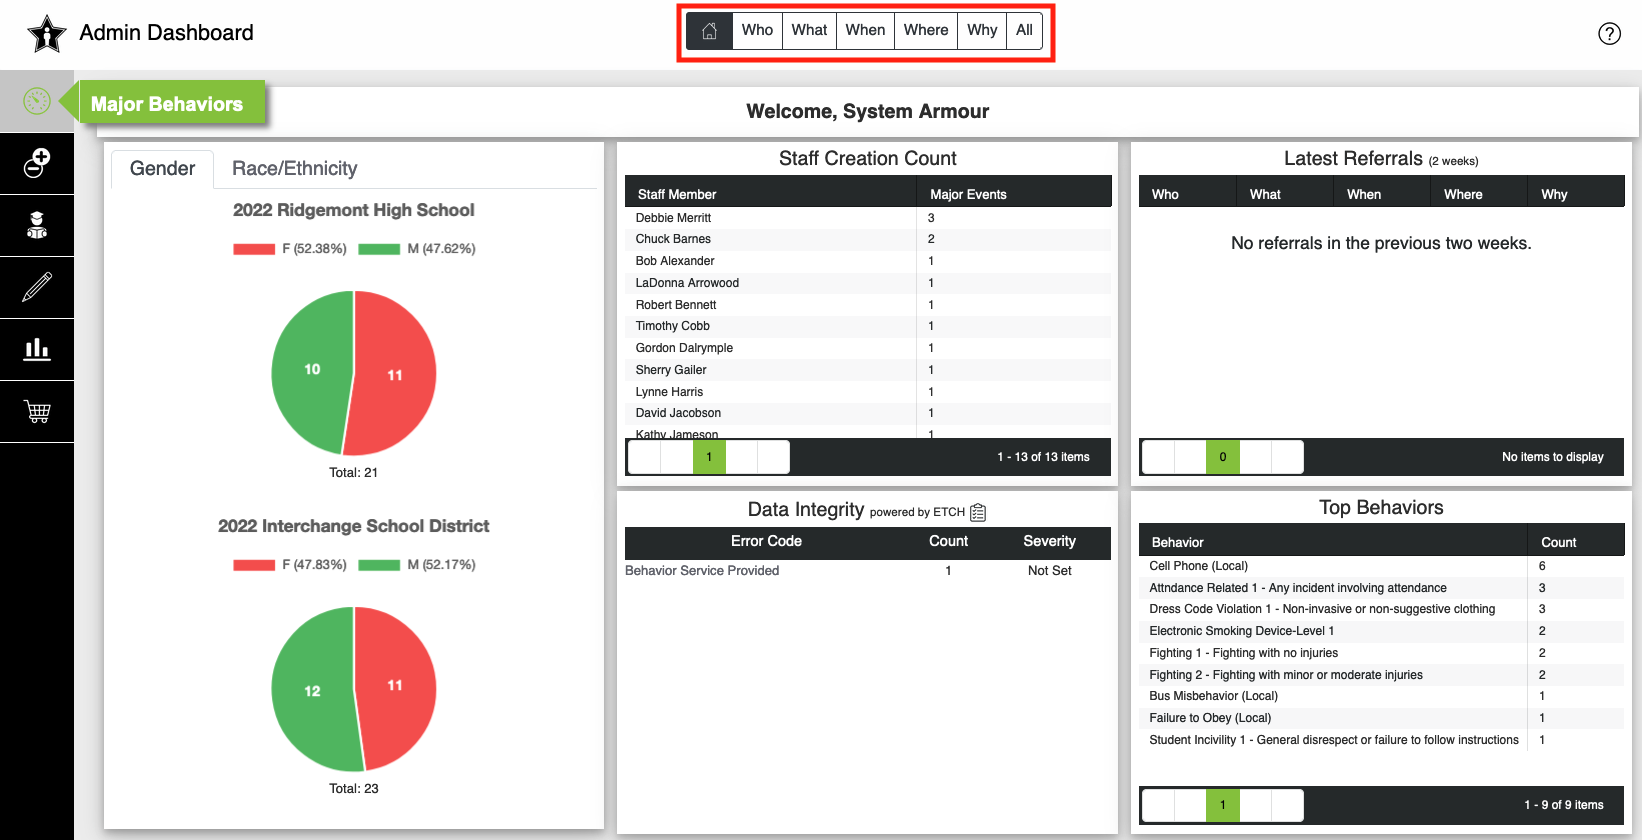
Who
The who tab is a display of events by grade and all behaviors. Click on the graph or student name to drill down to the details of the behavior events. Use the Filters button to apply additional filters to the data.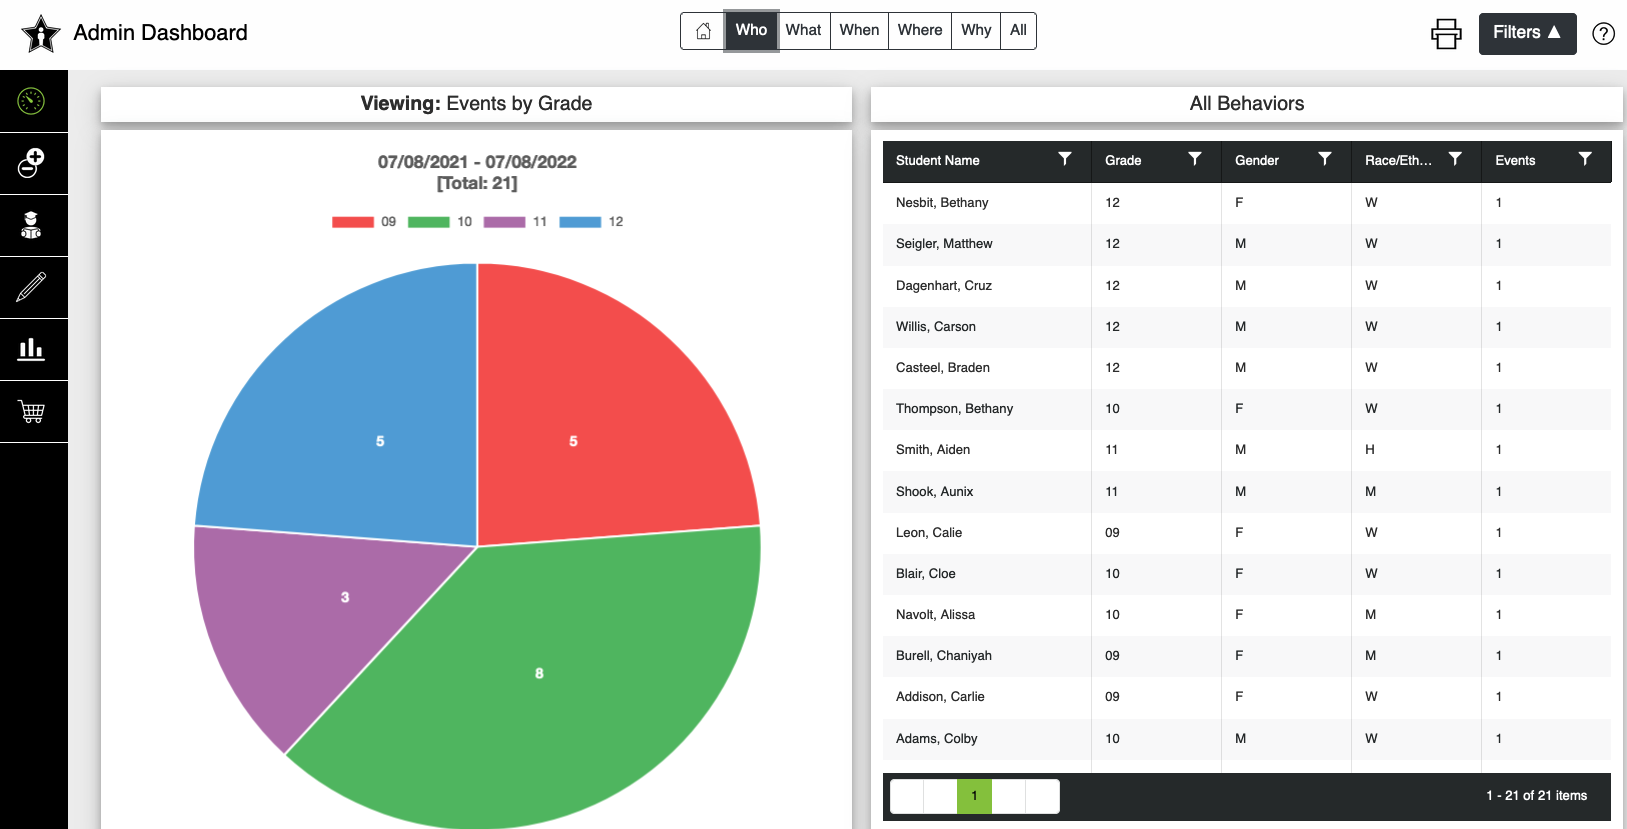
What
The what tab is a display of the behavior events by resolution type. Click on the graph to drill down to the details of the behavior events. Use the Filters button to apply additional filters to the data.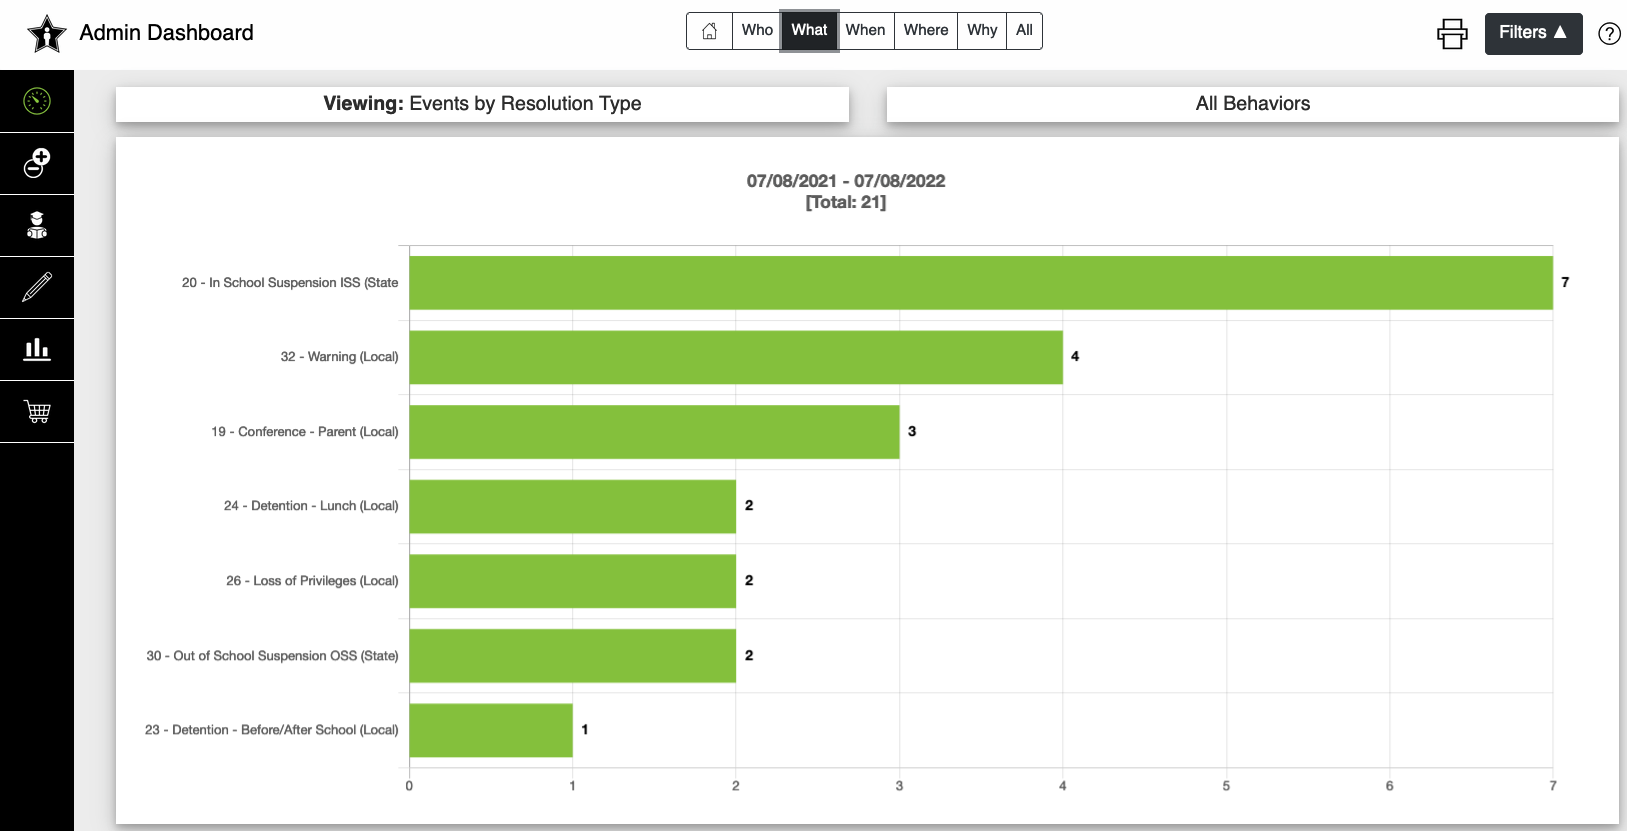
When
The when tab is a display of the behavior events by day/month/hour. The data can be viewed by Individual or Events. The totals will be based on how your behavior data is entered in Campus. Use the Filters button to apply additional filters to the data.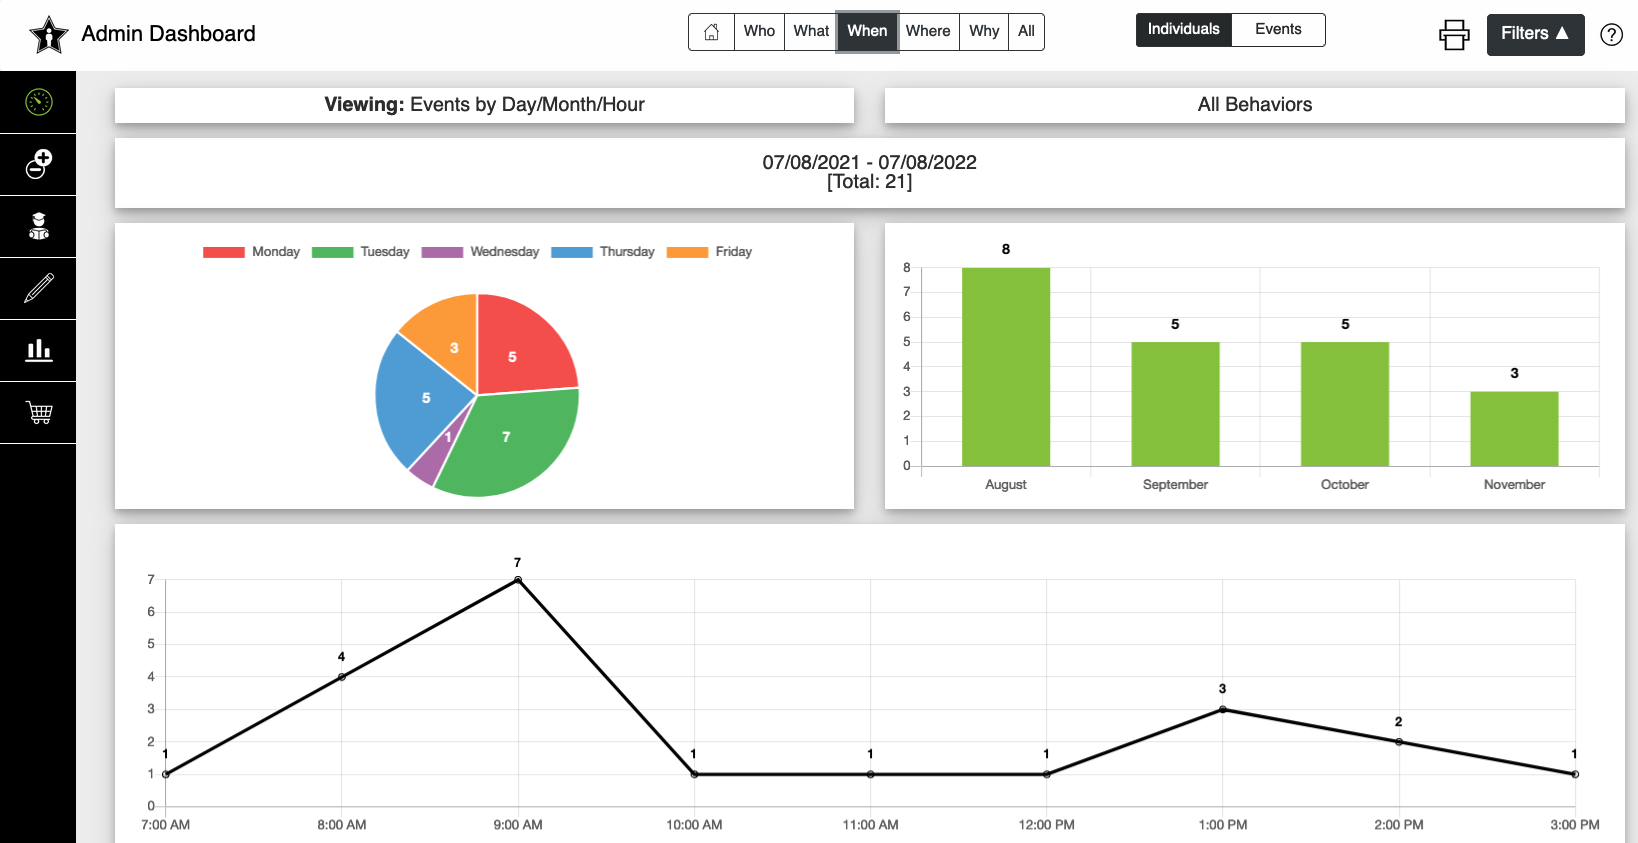
Where
The where tab is a display of the behavior events by location. The data can also be viewed by Individual or Events. The totals will be based on either your locations in Campus or SpotLight. Use the Filters button to apply additional filters to the data.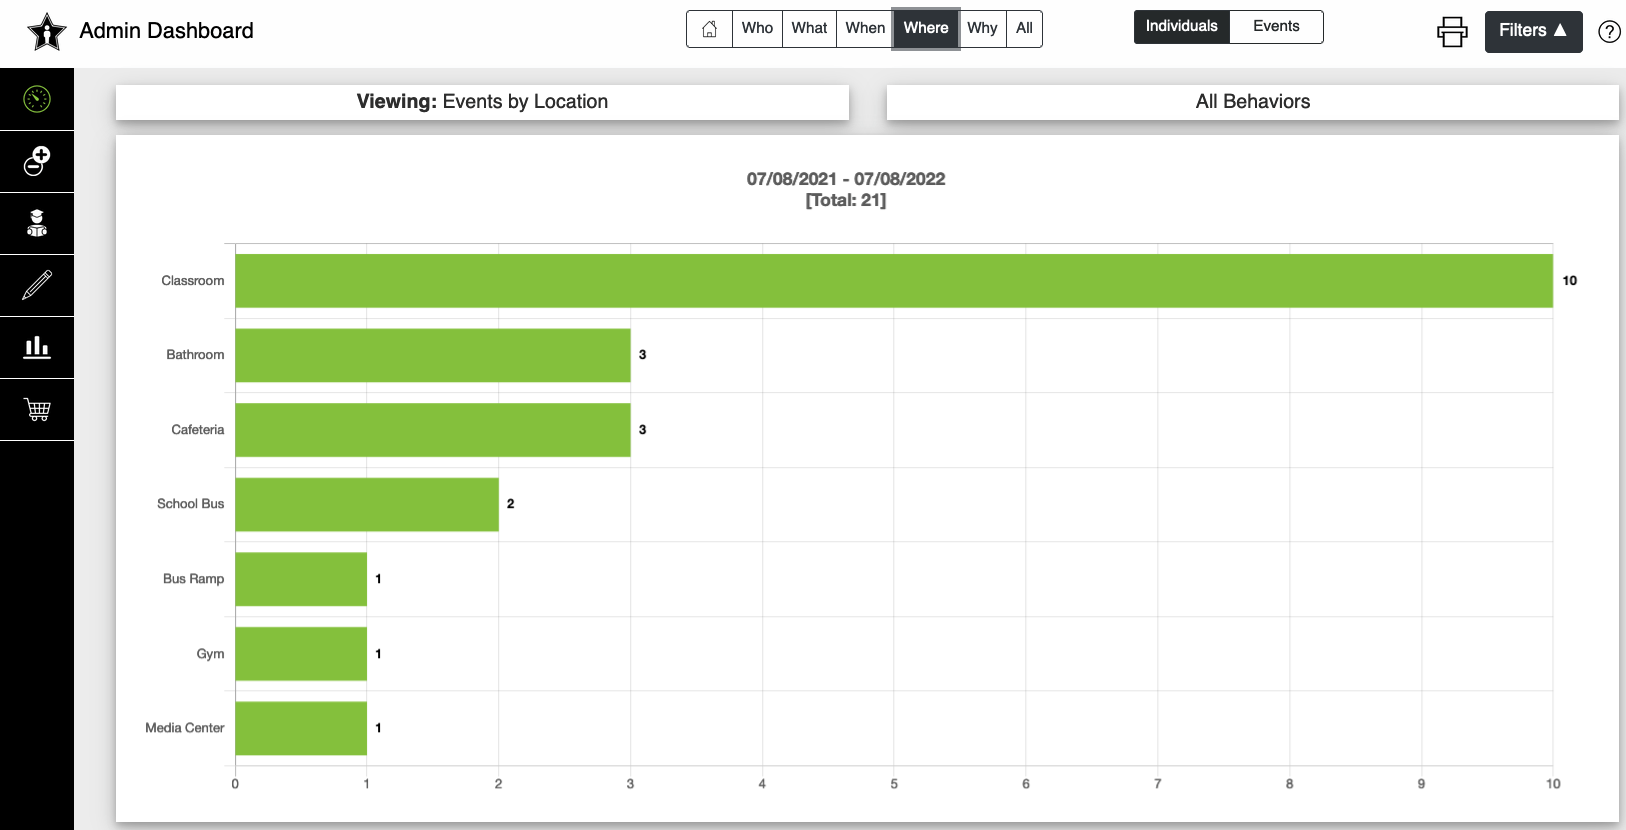
Why
The why tab is a display of the motivation and integrated wellness for behavior events. The totals for motivation will be based on either your custom motivation field in Campus or SpotLight. The totals for integrated wellness will be based on settings in SpotLight only. Use the Filters button to apply additional filters to the data.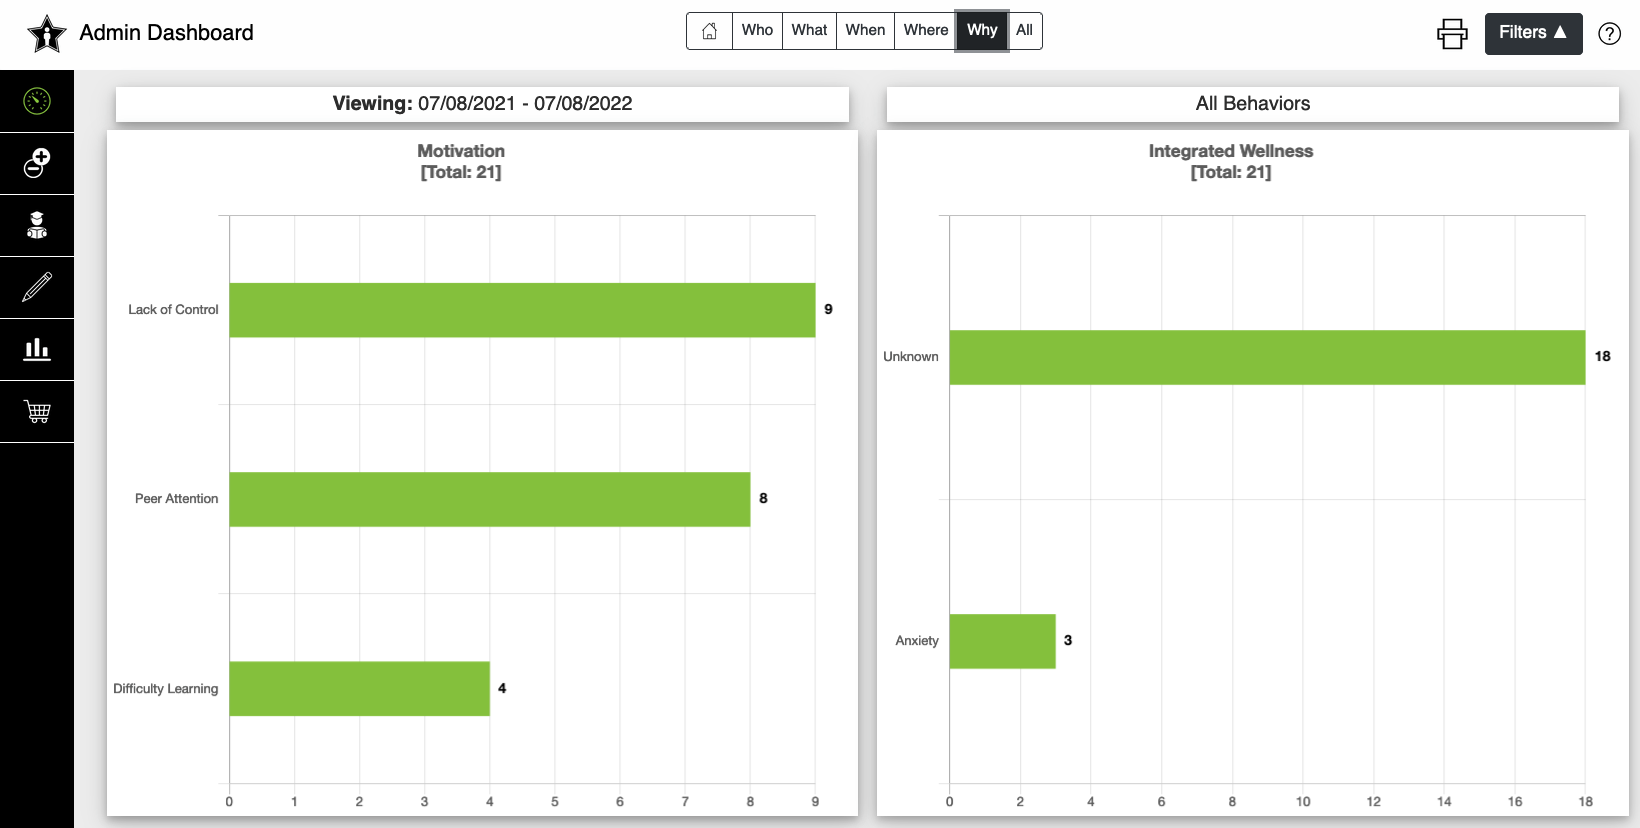
All
The all tab is a display of all behavior events in Campus. Use the column filters or the filters button to sort data as needed. The data can also be exported using the export button.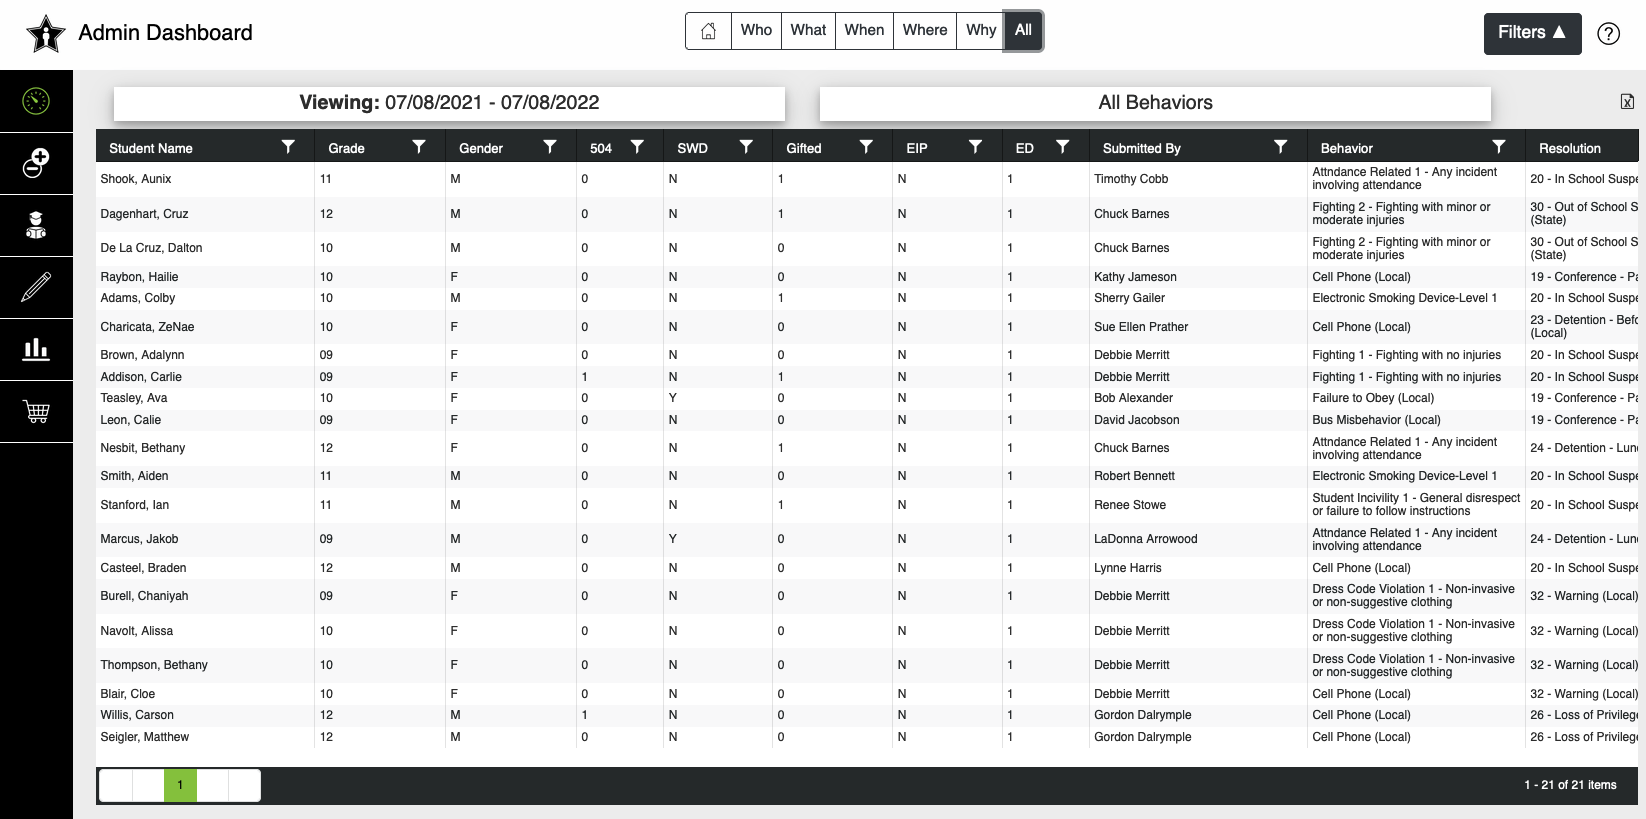
Classroom Behaviors
Use the Who/What/When/Where/All tabs to view minor and positive data based on grade, resolution, and time. Use the All tab to view a complete list of minor and positive referrals at your school. Use the dropdown filter to fine tune exactly what information is displayed.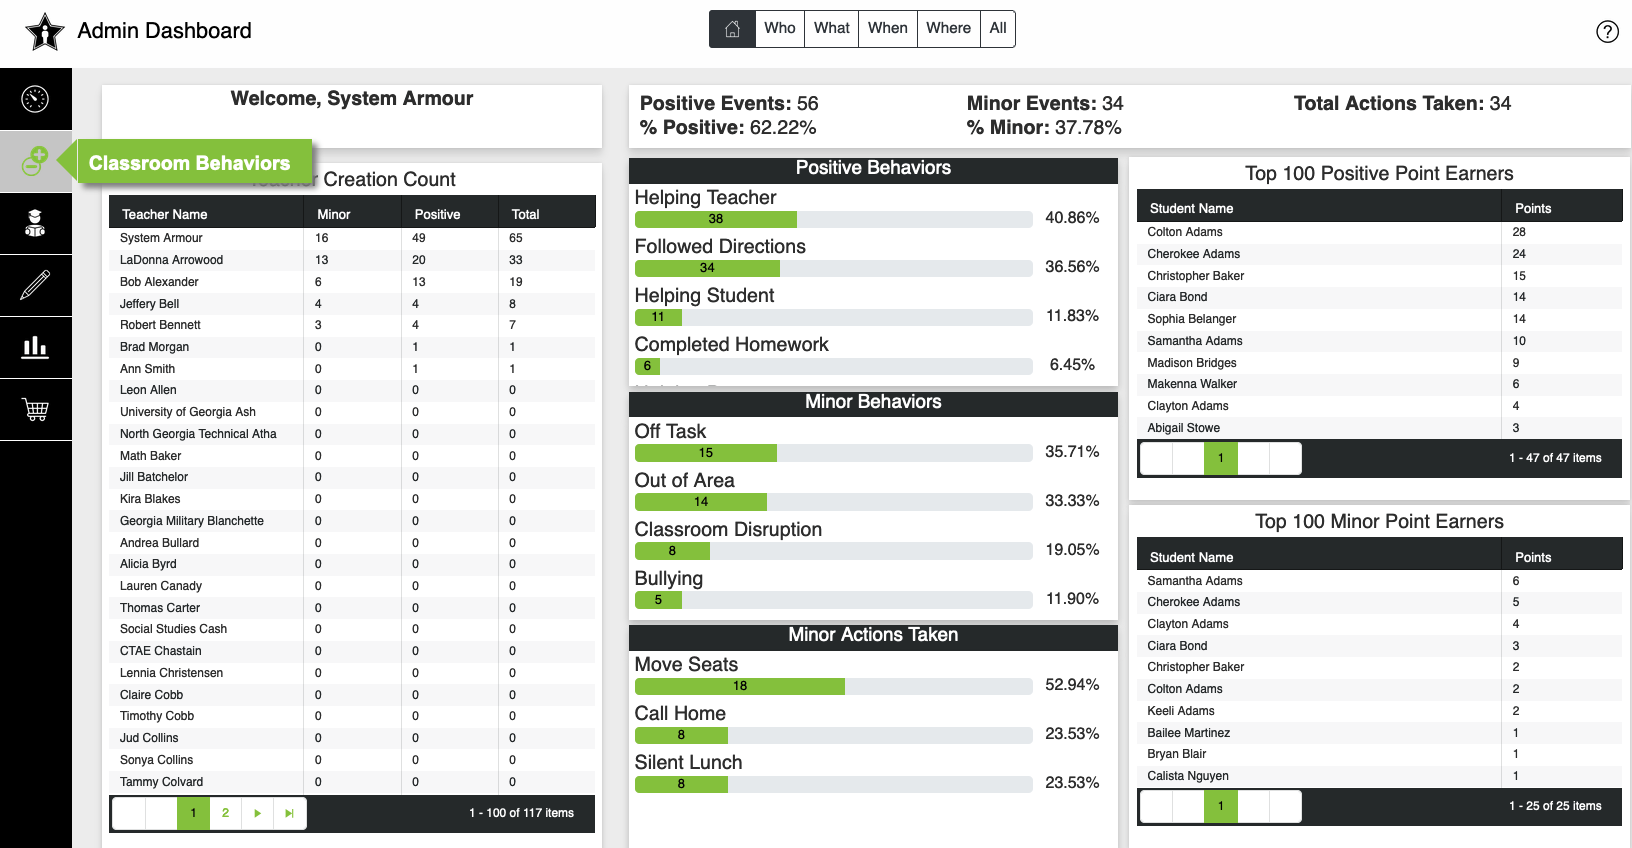
Who
The who tab is a display of positive or minor events by grade and all behaviors. The data can be viewed by Positive or Minor using the toggle at the top. Click on the graph or student name to drill down to the details of the behavior events. Use the Filters button to apply additional filters to the data.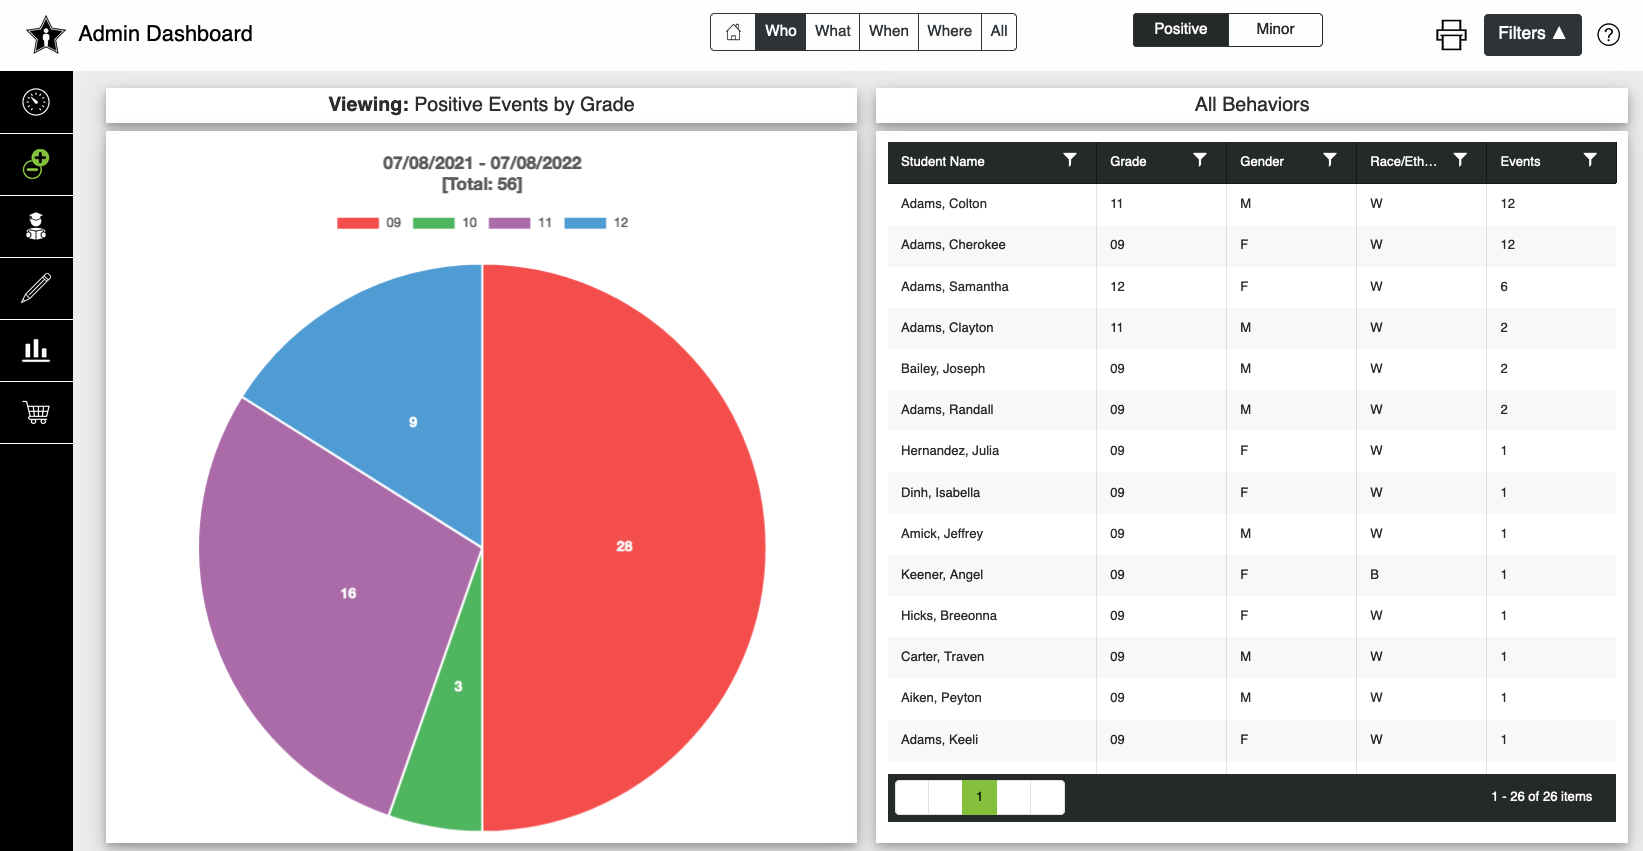
What
The what tab is a display of the minor behavior events by actions taken. Click on the graph to drill down to the details of the behavior events. Use the Filters button to apply additional filters to the data.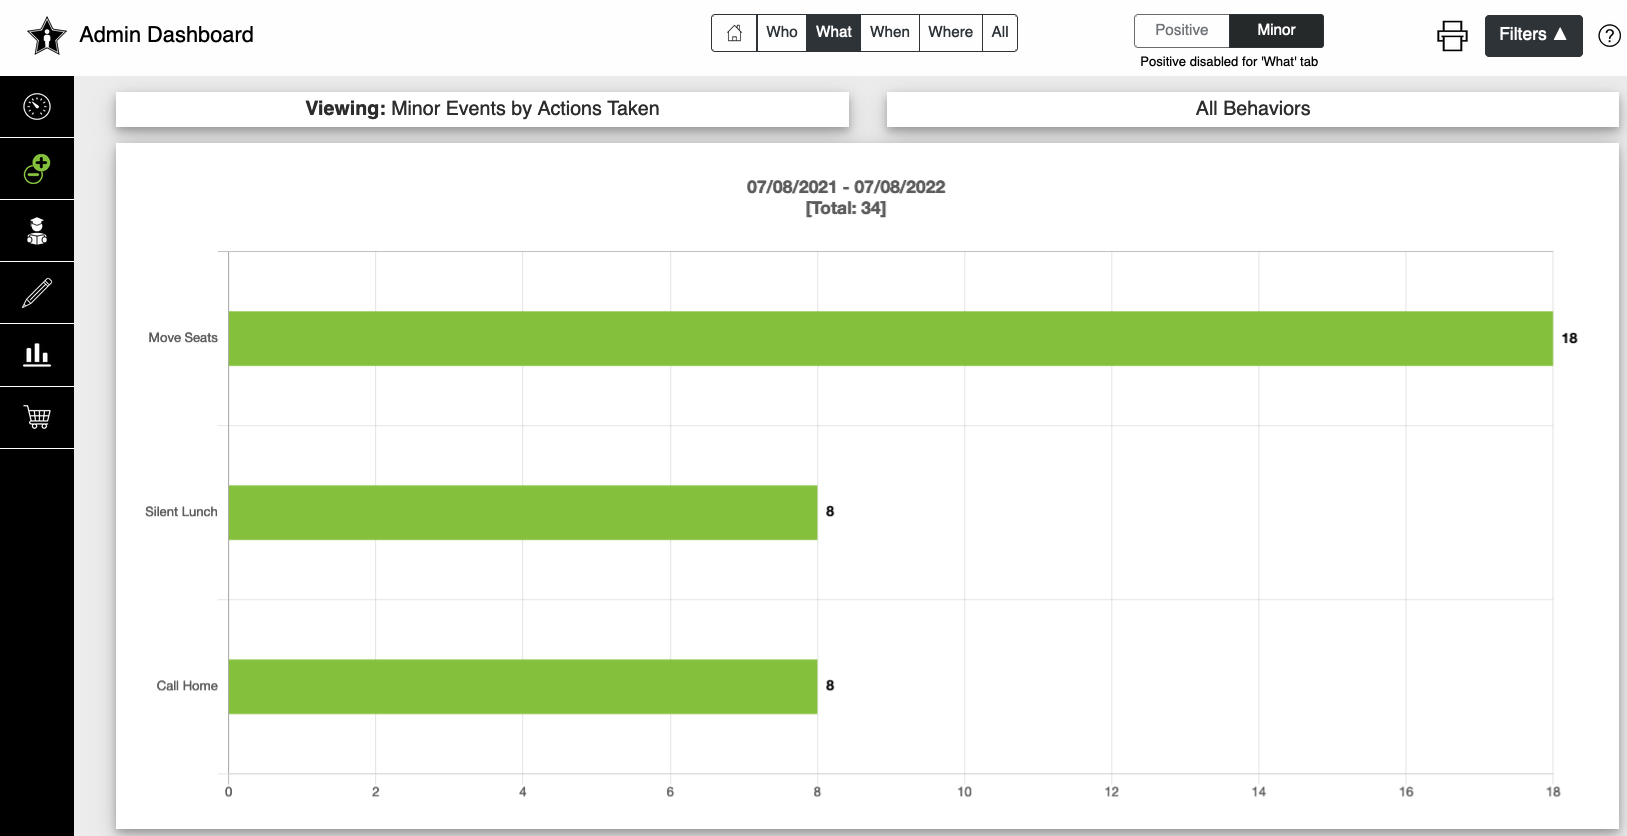
When
The when tab is a display of the positive or minor behavior events by day/month/hour. The data can be viewed by Positive or Minor using the toggle at the top. Use the Filters button to apply additional filters to the data.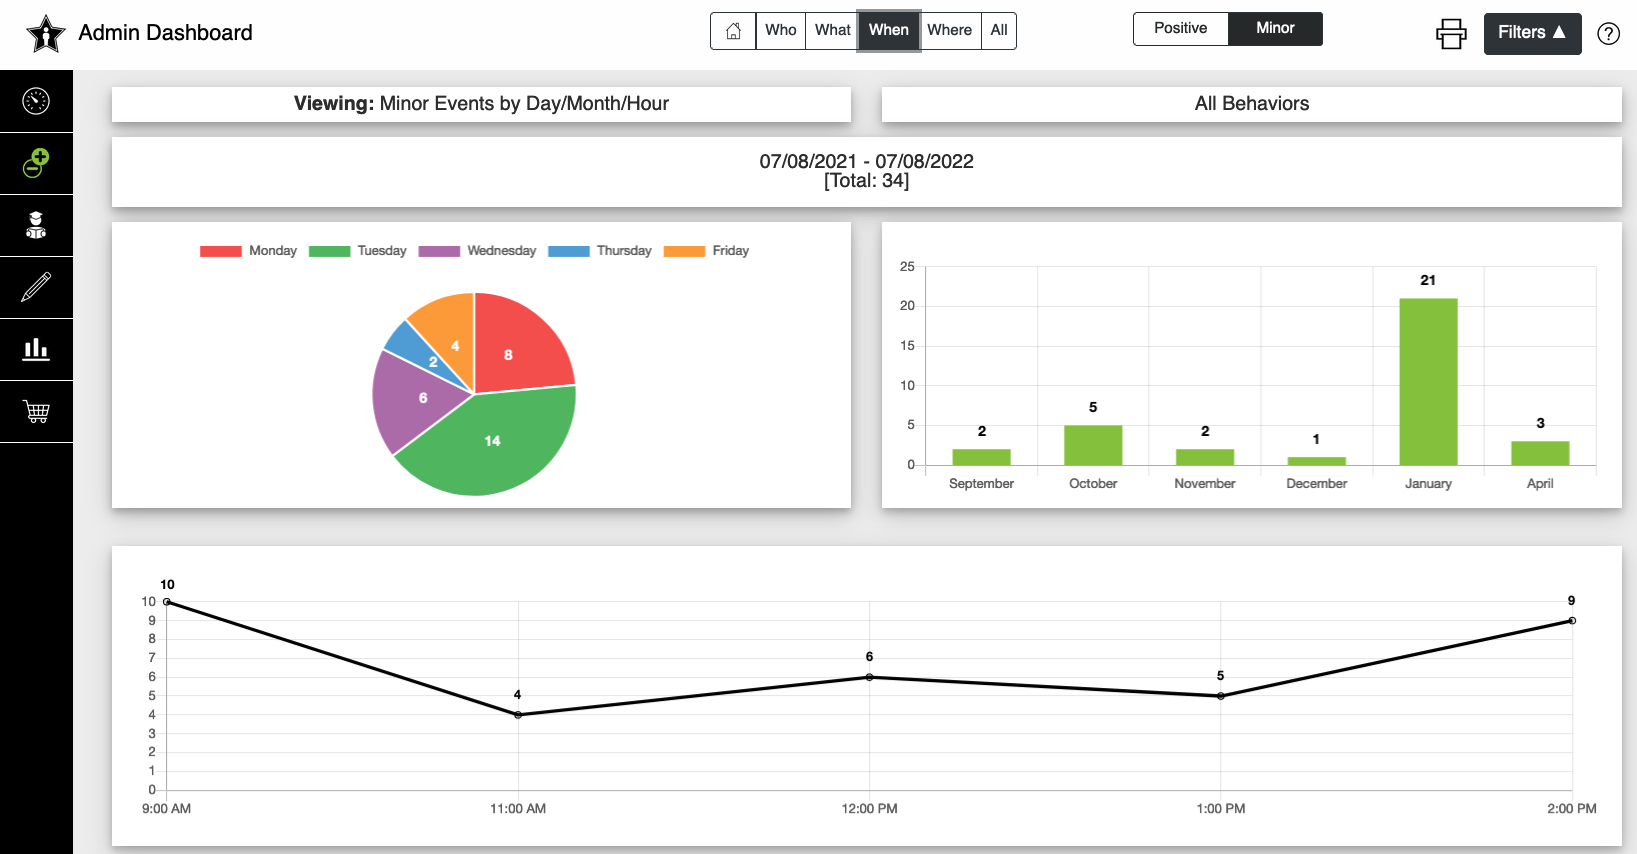
Where
The where tab is a display of the positive and minor behavior events by location. The data can also be viewed by Positive or Minor using the toggle at the top. The totals will be based on either your locations in Campus or SpotLight. Use the Filters button to apply additional filters to the data.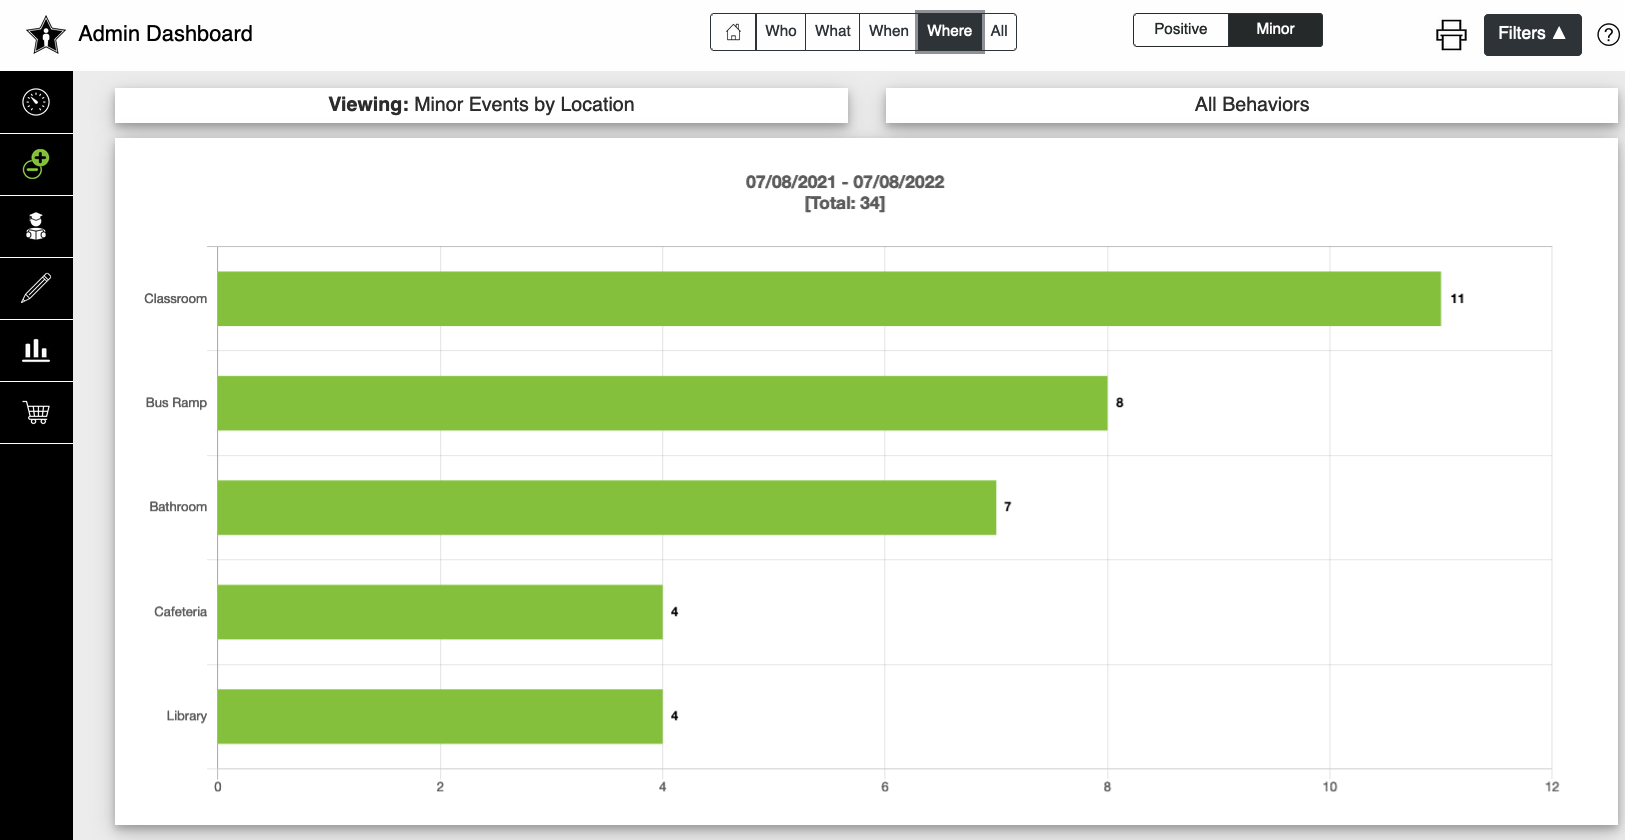
All
The all tab is a display of all minor or positive behavior events in SpotLight. Use the column filters or the filters button to sort data as needed. The data can also be exported using the export button.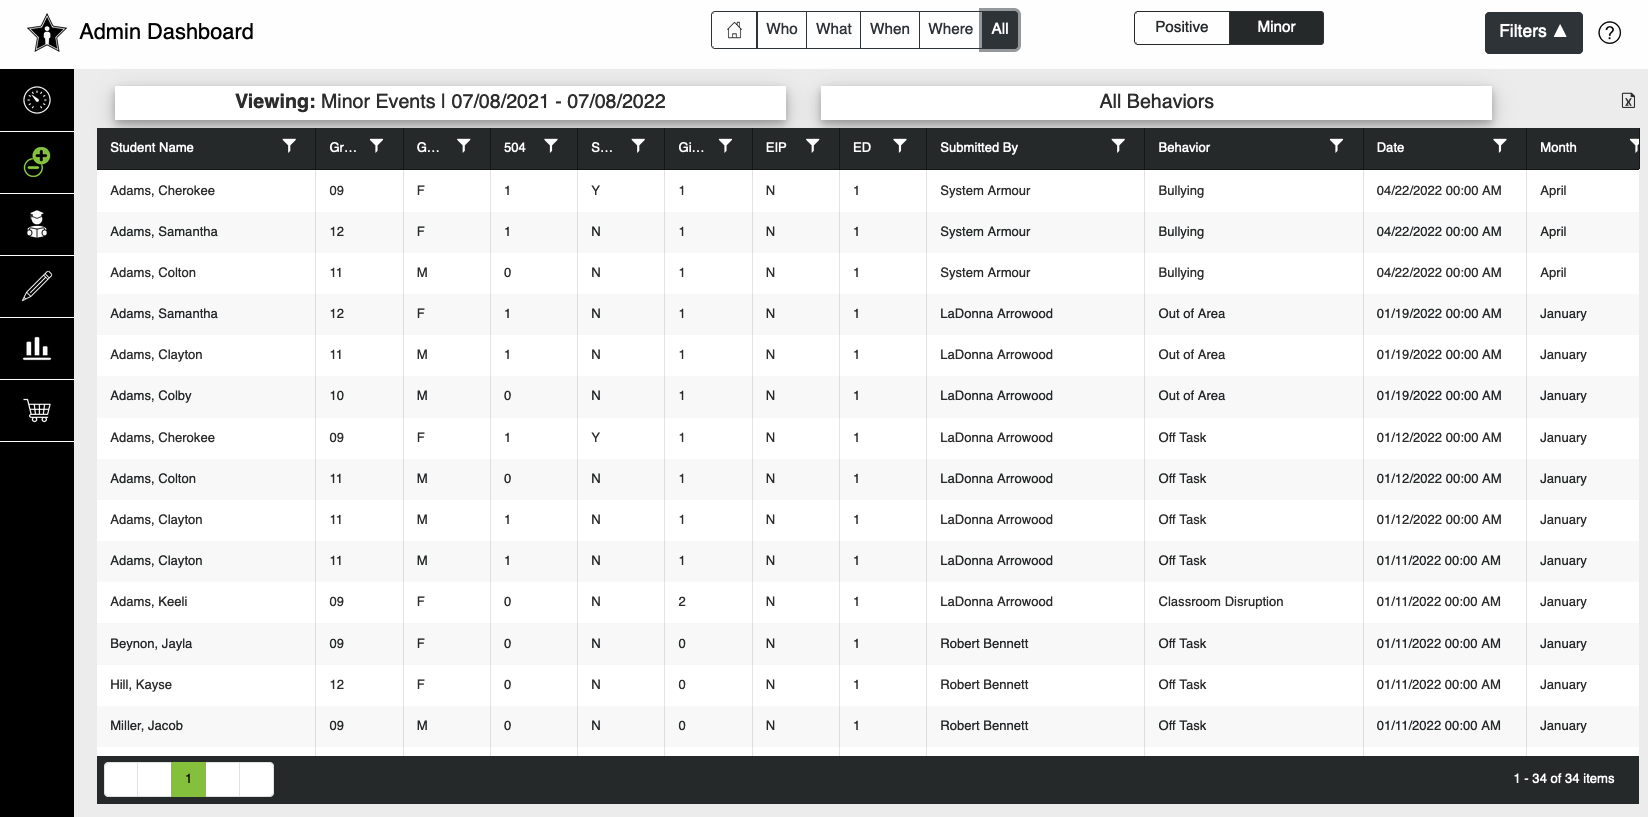
Student Overview
Displays demographic data, major, minor, and positive referrals for a particular student. Choose whether to display the data for the current calendar, or all calendars associated with the student.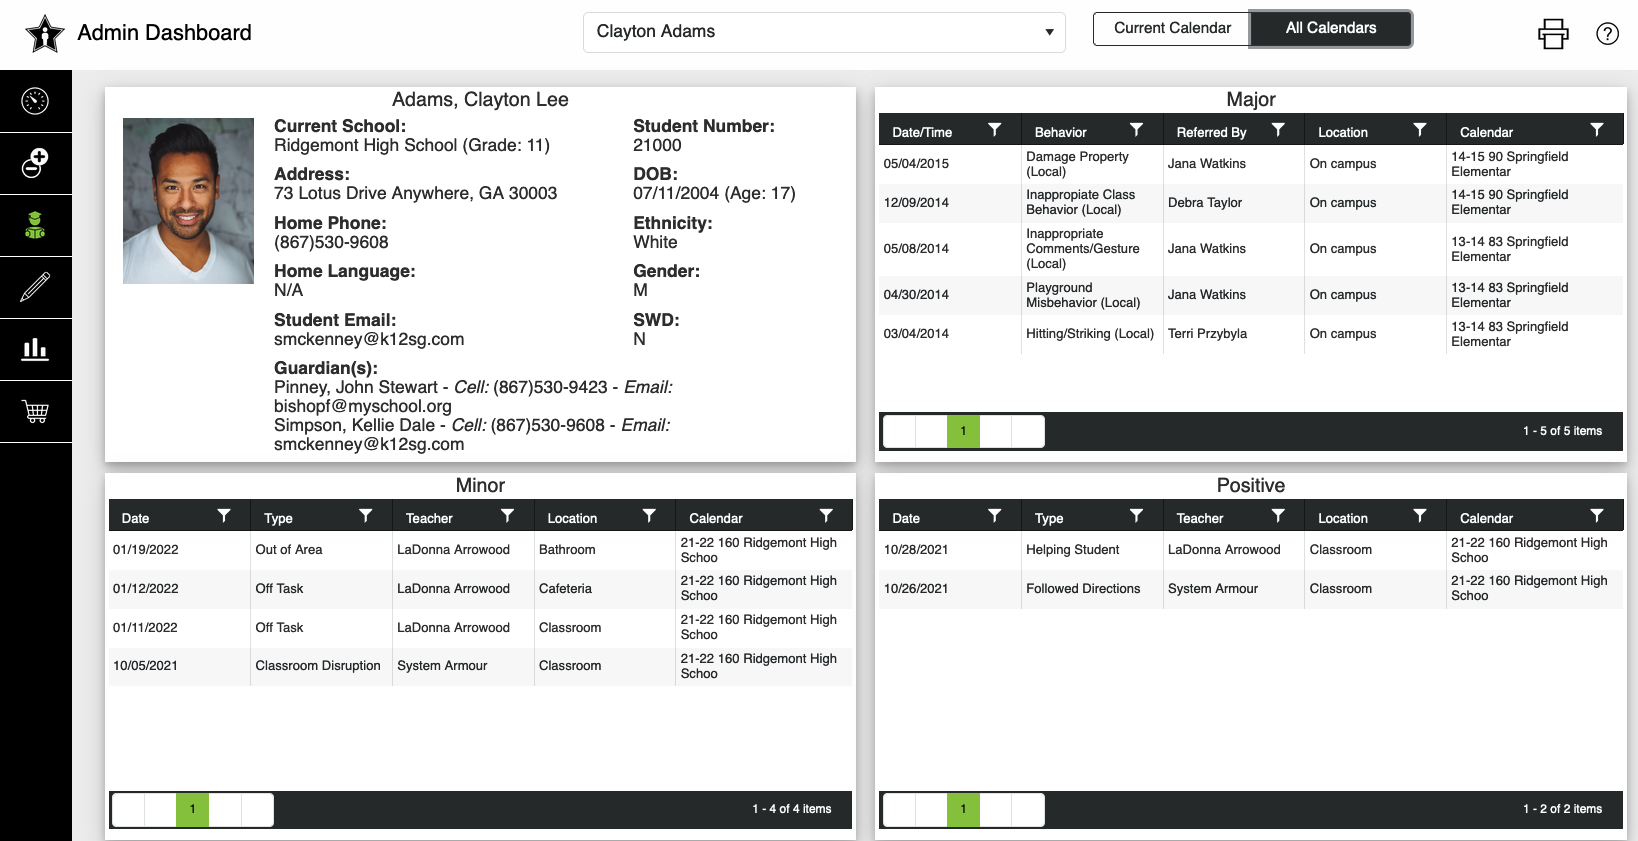
Teacher Overview
Displays all minor, positive, and major referrals created by a specific teacher.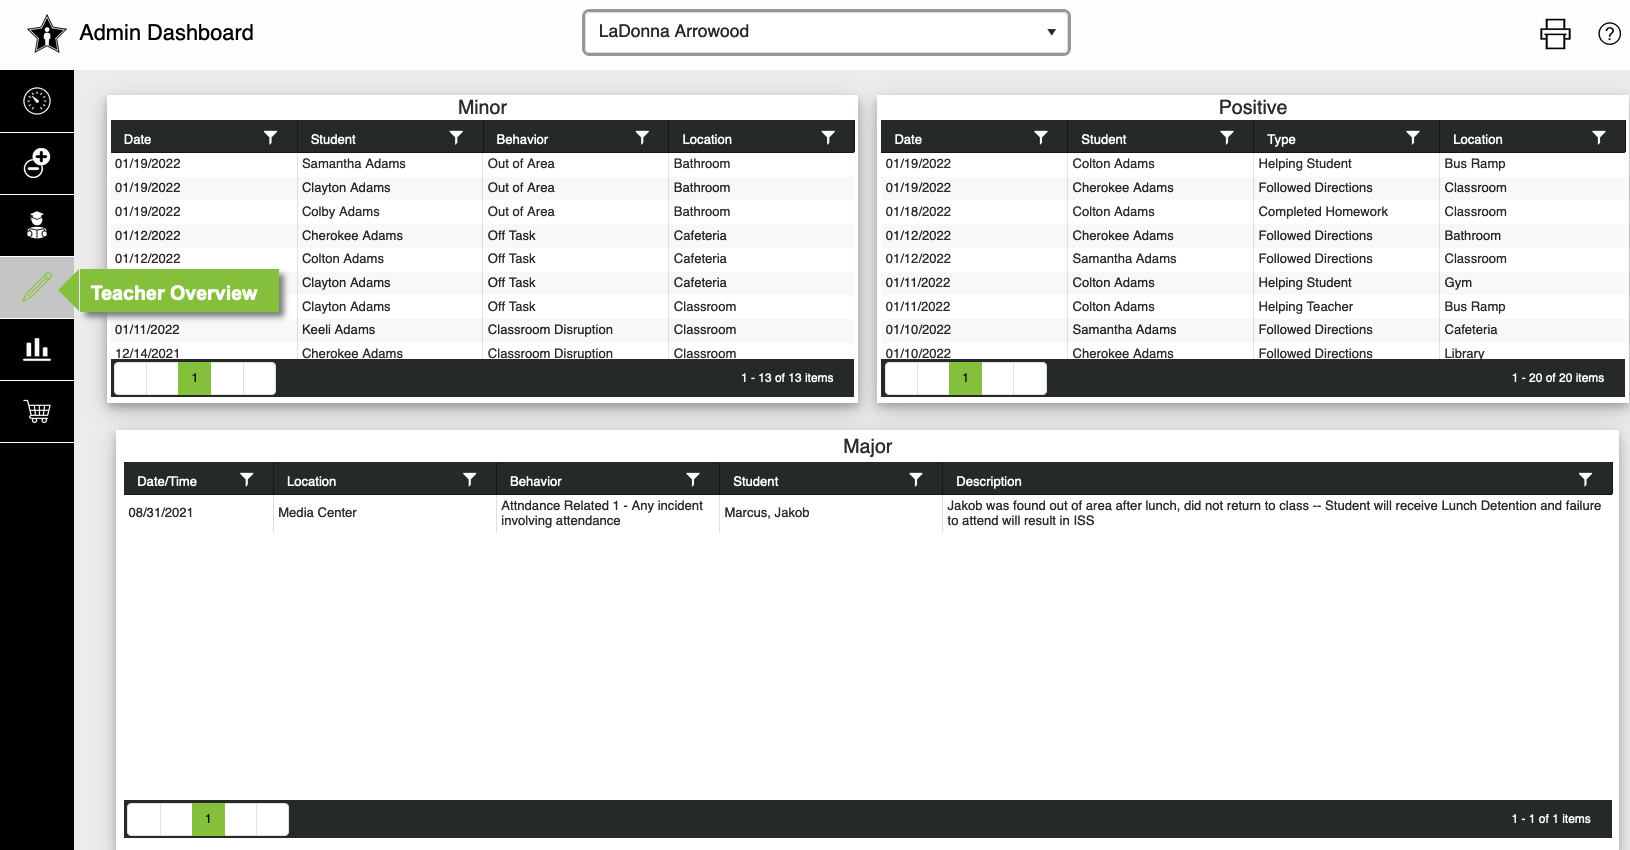
Reports
View a list of pre-generated Year-over-year reports, based on yearly totals, grade, top 10 behaviors, monthly totals, and more. The data can be compared for up to 5 years (default). Use the comparing last drop down to reduce the number of years to compare. Or depending on the report, deselect the years not needed by clicking on the report key.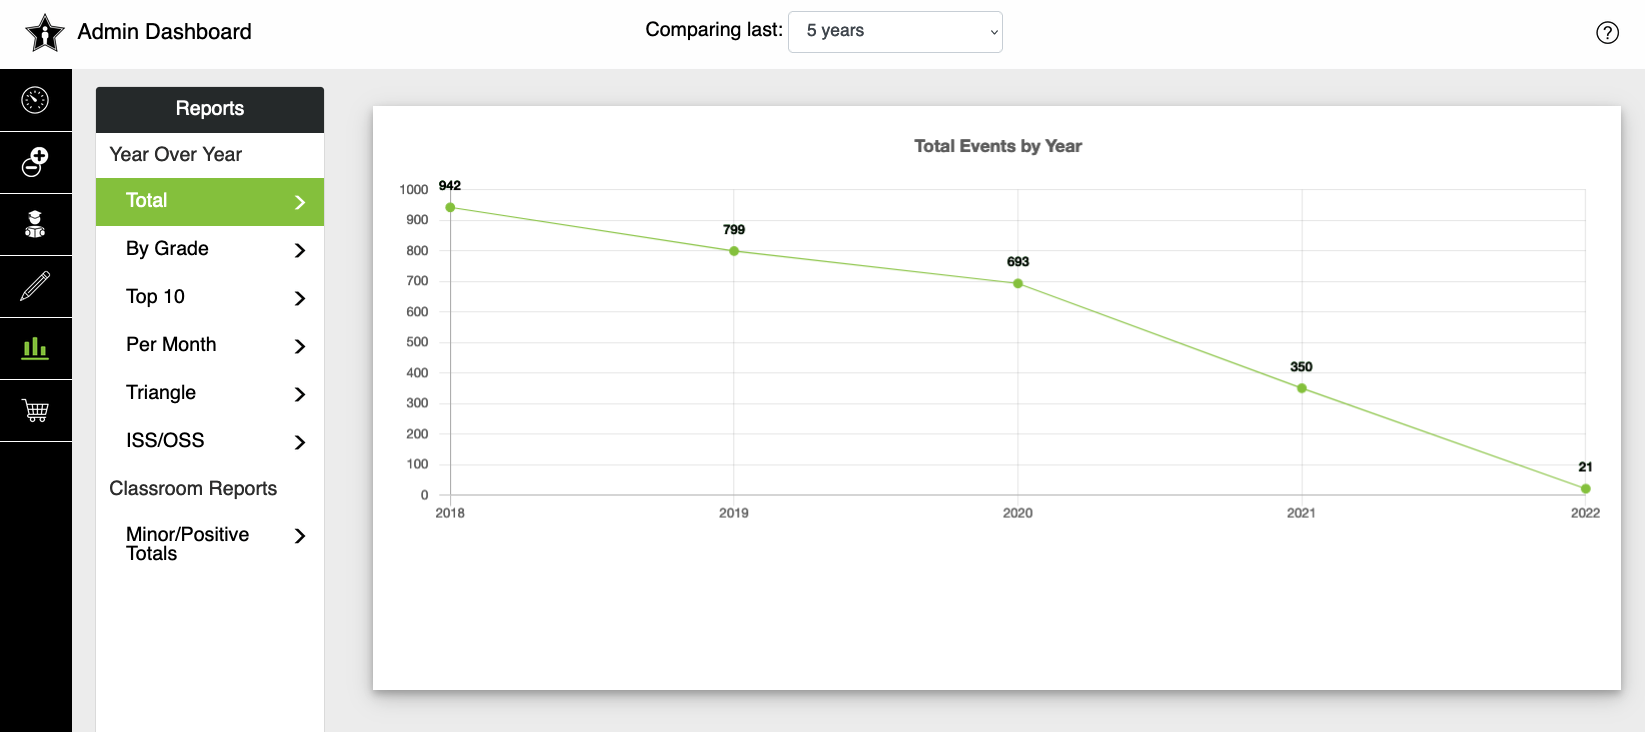
SpotLight Store
'Spend' positive points a student has earned, or view a history of all SpotLight Store transactions. The store from the Admin Dashboard will display all student(s) with the points they have earned.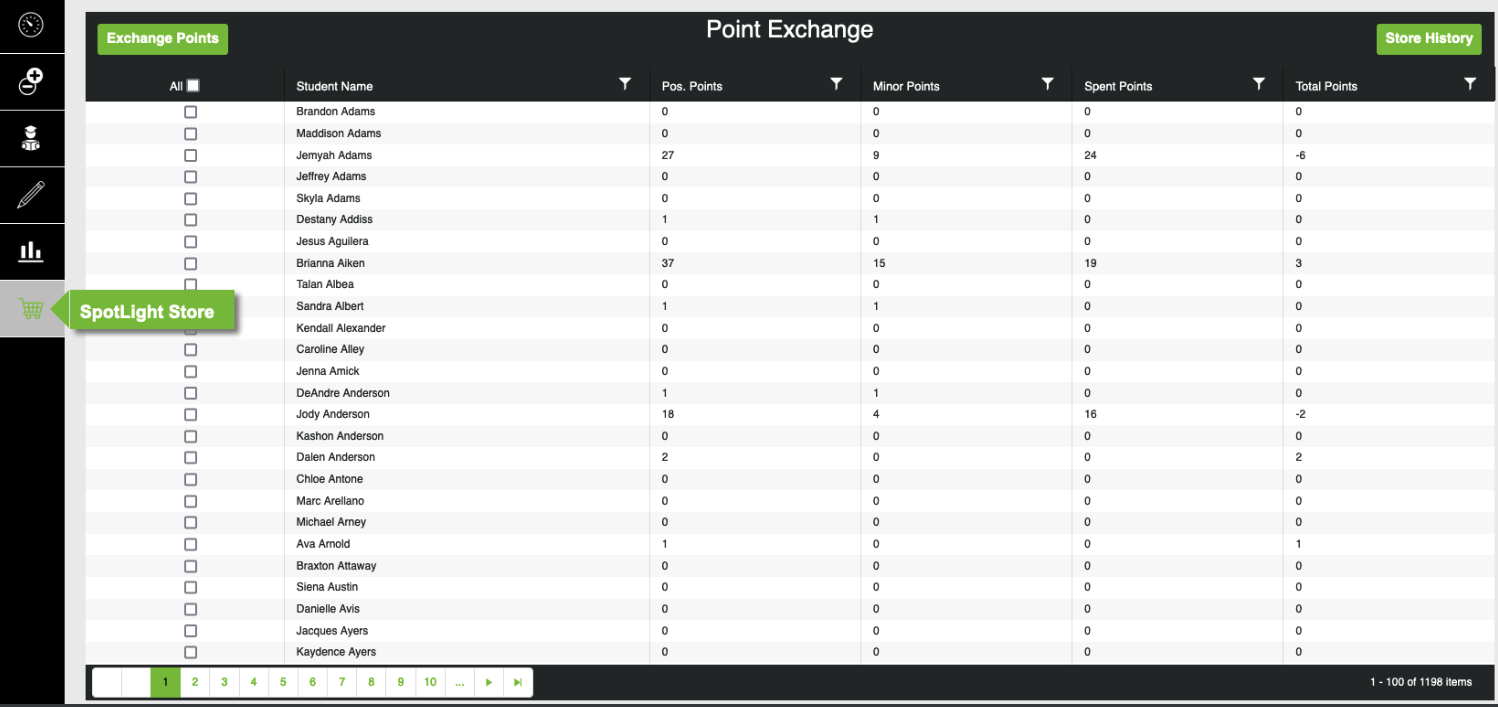
Exchange Points
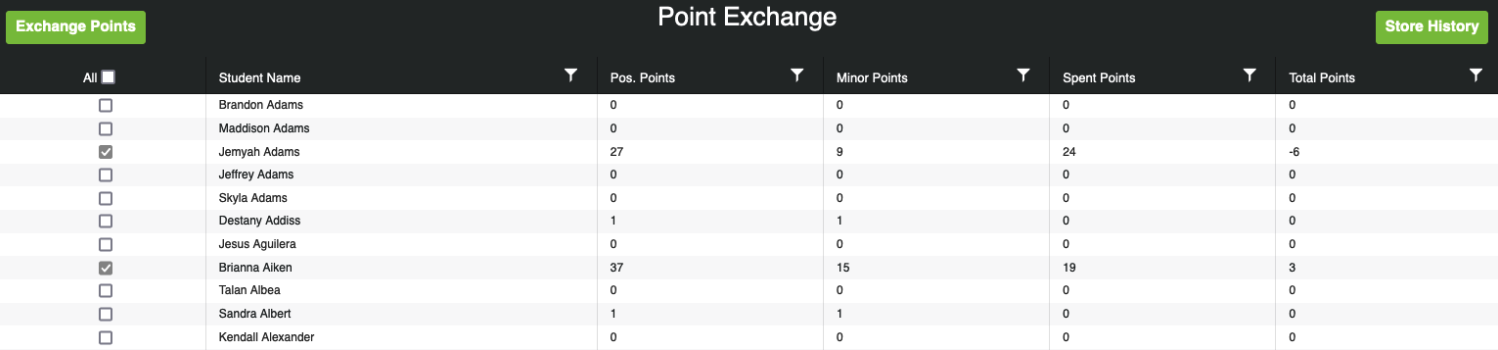
To exchange points for store items, click the check box next to the student(s) name and then click Exchange Points.NOTE: Multiple students can be selected at once. Use the column headers to sort data or use the filter to filter data as needed.
After clicking the Exchange Points option, select the Items to Exchange, enter Comments and click Exchange.
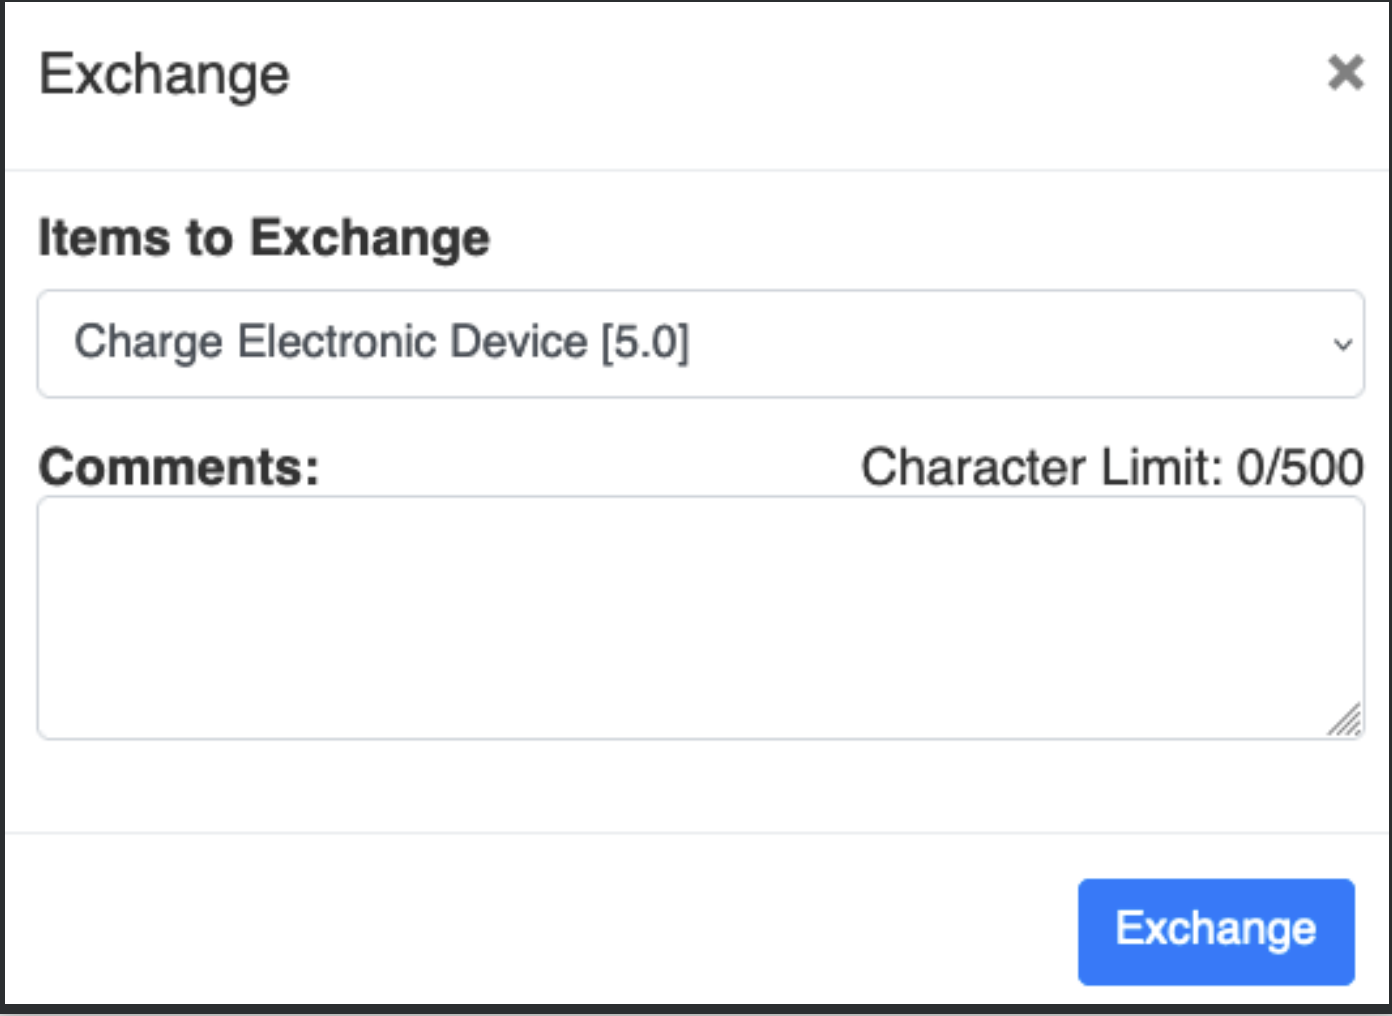
Once points are Exchanged, points will be 'deducted' from the student's bank of points.
If you have additional questions you can contact us:
By Email:
By Phone: (706) 520-1125
A representative from our support team will respond to you as soon as possible.
By Email:
By Phone: (706) 520-1125
A representative from our support team will respond to you as soon as possible.